Drag & Drop IDE
Rapise scripts are written in JavaScript. In addition to the autogenerated script created during recording, you can run and debug your script using the full featured integrated JavaScript Editor and Debugger. Rapise includes a testing API, with methods for manipulating images, spreadsheets, common GUI widgets, and more.
JavaScript Editor
Rapise comes with a fully-featured JavaScript editor:
The Rapise JavaScript editor lets you display and edit JavaScript files. The editor supports Syntax Highlighting, Syntax Checking, Code Folding and Code Completion:
- With Syntax Highlighting, words in a program are displayed so as to immediately indicate their function. Reserved words, variables, literals, and comments may be differentiated by color, boldness, underline etc. Syntax Highlighting makes programs easier to read and modify.
- Rapise performs Syntax Checking as you type into the Source Editor. Messages regarding syntax errors can be found in the Warning View.
- Code Folding allows you to hide or show blocks of code. These blocks have syntactic meaning, such as a function body, a class declaration, a loop, or a comment.
- Rapise provides Code Completion for class, method and field names. To use code completion, you just need to start typing a class, method, or field name. Pressing CTRL+Space will open a list of possible completions.
Syntax Highlighting
With Syntax Highlighting, words in a program are displayed so as to immediately indicate their function. Reserved words, variables, literals, and comments may be differentiated by color, boldness, underline etc.
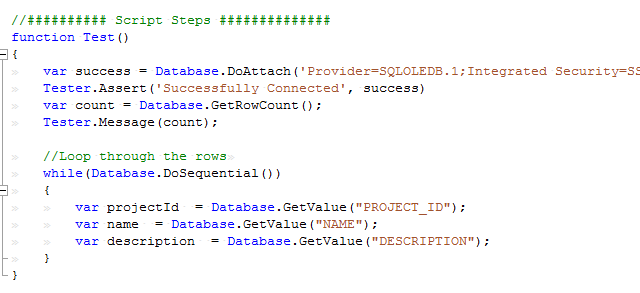
Syntax Highlighting makes programs easier to read and modify.
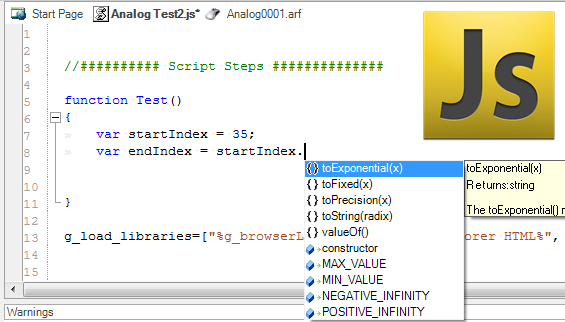
Code Completion
Rapise provides Code Completion for class, method and field names. To use code completion, you just need to start typing a class, method, or field name.
Pressing CTRL+Space will open a list of possible completions.
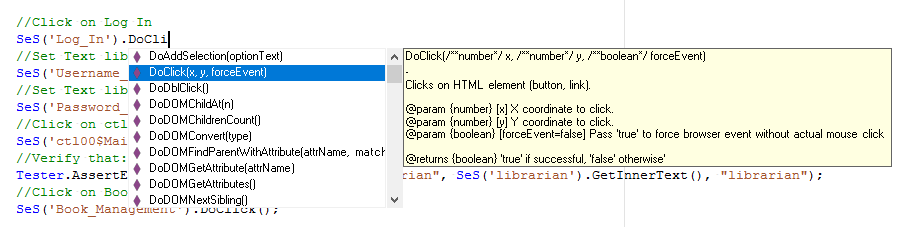
Drag and Drop Editing
The Rapise script editor (IDE) provides drag and drop editing of the test scripts. Simply drag the desired object from the Object Tree and Rapise will automatically add the correct object reference to your test script:

In addition, if you drag and drop a specific object method, Rapise will automatically add both the object reference and the function signature.
JavaScript Debugger
Rapise includes an internal JavaScript debugger:

The Rapise debugger provides Persistent Breakpoints, Control Execution, a Watch View, a Variable/Call Stack View and Tooltips:
- Breakpoints stop execution of the test at a specific line in the script. They allow you to investigate program state, and trace execution flow. With persistent breakpoints, the breakpoints are saved with the test script so that they are remembered when you subsequently open the test.
- Control Execution allows you to manually direct the execution of the script during the debugging section. This can be useful if you need to test out a specific section of code.
- The watch view allows test engineers to input expressions and view their values as the script executes.
- The variable/call stack view lists the functions in the current call stack. Beneath each function, variables/objects local to that function are listed with their value and type.
- Tooltips let you view a variable's value during debugging.
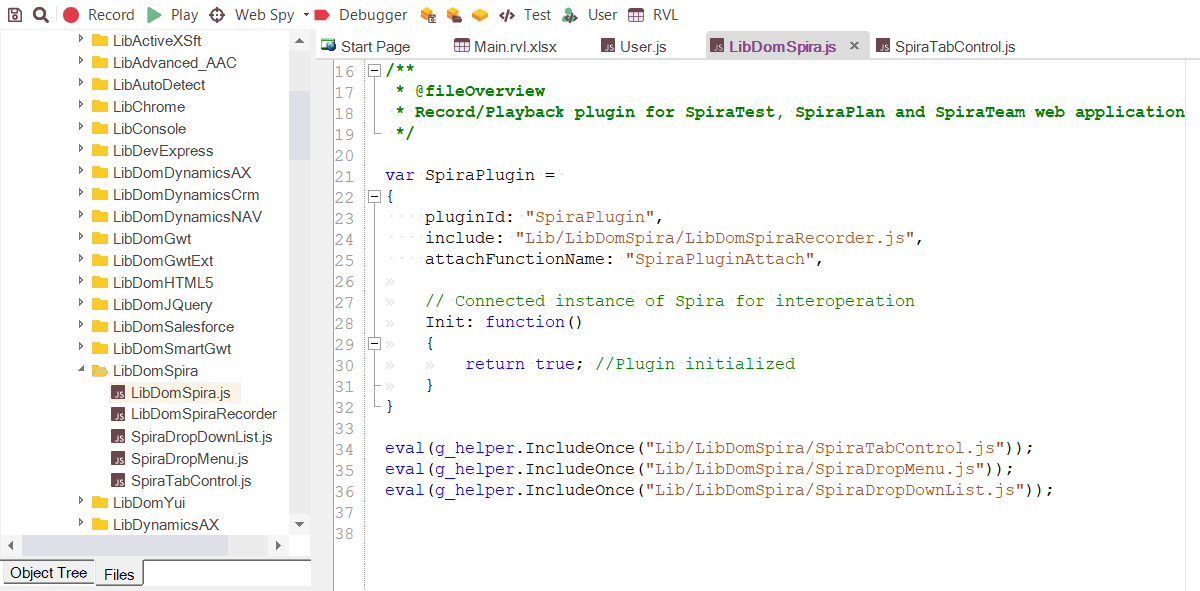
Customizable Engine
The source for most of the Rapise implementation is available for you to read and modify. You may find it useful to look at if you decide to create a library customized for your application.
Try Rapise free for 30 days, no credit cards, no contracts
Start My Free TrialAnd if you have any questions, please email or call us at +1 (202) 558-6885