Background
Sometimes you might need to show a Graph with all the Requirements by status for all open Releases in Spira.
Writing ESQL Query:
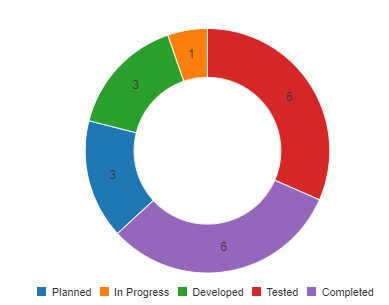
The graph can be a donut Graph with Requirement status as the 'axis', filtered by the Release status being NOT closed or completed, and only include requirements that have not been deleted
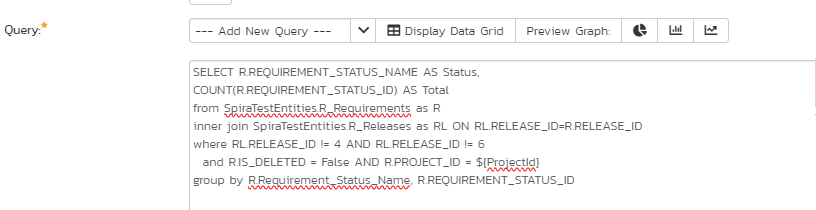
Using the option to Create a Custom Graph, copy and paste ESQL into the Query section:
SELECT RQ.REQUIREMENT_STATUS_NAME AS Status,
COUNT(RQ.REQUIREMENT_STATUS_ID) AS Total
FROM SpiraTestEntities.R_Requirements as RQ
INNER JOIN SpiraTestEntities.R_Releases as RL ON RL.RELEASE_ID=R.RELEASE_ID
WHERE RL.RELEASE_ID != 4 AND RL.RELEASE_ID != 6
  AND RQ.IS_DELETED = False AND RQ.PROJECT_ID = ${ProjectId}
group by RQ.Requirement_Status_Name, RQ.REQUIREMENT_STATUS_ID
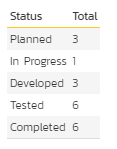
So you would get
Understanding the query
The SELECT statement extracts all the available Requirement Statuses and counts number of items under each status:
SELECT RQ.REQUIREMENT_STATUS_NAME AS Status,
COUNT(RQ.REQUIREMENT_STATUS_ID) AS Total
JOIN operation filters and matches those of Requirements, that have assigned a Release
INNER JOIN SpiraTestEntities.R_Releases as RL ON RL.RELEASE_ID=RQ.RELEASE_ID
Based on JOIN operation we can filter the Releases that have status other than closed or completed:
WHERE RL.RELEASE_ID != 4 AND RL.RELEASE_ID != 6
Deleted Requirements should not be included in this list. And we also want to make sure results are shown for the current Product only:
RQ.IS_DELETED = False AND RQ.PROJECT_ID = ${ProjectId}
If you would like to get all the requirements across the System feel free to remove 'AND RQ.PROJECT_ID = ${ProjectId}' part of the last statement.
Example: Creating a Donut Graph
If you click on Display Data Grid the Result should be shown below the query box:
And the Donat Graph will be generate if you click on the Pie icon next to the Preview Graph:
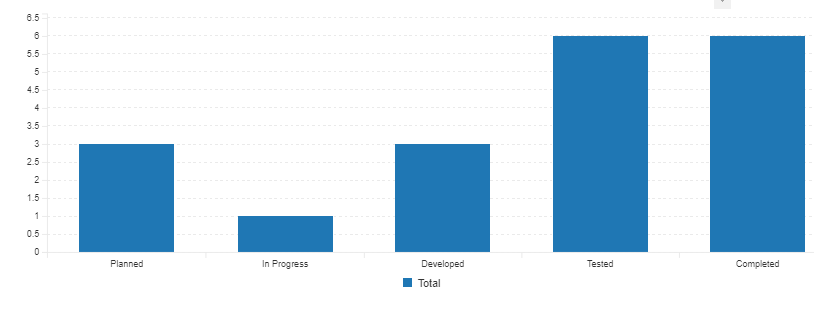
Example: Creating a Bar Chart
If you would like to get the Bar Chart - click on the Bars icon next to the Pie chart icon: