Risk Analysis
When risks are identified by the team, some risks may not warrant the return on investment based on expert judgment. For instance, a collocated team may identify the office being shut down due to the closure of the highway leading to the office. While that is definitely a risk that impacts the project outcomes, addressing such risks may be outside the purview of the team as the organizational business continuity and disaster planning directives may address such a risk. As a result, such risks may be rejected. Some risks may have been closed due to the specific stage in the project. Such risks are then considered accepted risks without any response plan. Any identified risk that is not accepted therefore requires further evaluation.
SQL Query
select
  RA.RISK_TYPE_NAME,
   SUM(RA.Analyzed + RA.Evaluated + RA.Open) as Unresolved,
   SUM(RA.Rejected + RA.Closed) as Accepted,
   SUM(RA.Total) as Total,
   SUM(Cast (RA.Analyzed as double)+ Cast(RA.Evaluated as double)+ Cast(RA.Open as double))/SUM(Cast (RA.Total as double)) as PERC_UNRESOLVED,
   SUM(Cast (RA.Rejected as double)+ Cast(RA.Closed as double))/SUM(Cast (RA.Total as double)) as PERC_ACCEPTED
from
(
(select RK.RISK_TYPE_NAME, COUNT(RK.RISK_ID) as Identified, 0 as Analyzed, 0 as Evaluated, 0 as Open, 0 as Closed, 0 as Rejected, 0 as Total
from SpiraTestEntities.R_Risks as RK
join SpiraTestEntities.R_RiskStatuses as RS on RK.RISK_STATUS_ID = RS.RISK_STATUS_ID
where RK.PROJECT_ID = ${ProjectId} AND RK.RISK_STATUS_NAME = 'Identified' and RK.IS_DELETED = False
group by RK.RISK_TYPE_NAME)
union
(select RK.RISK_TYPE_NAME, 0 as Identified, COUNT(RK.RISK_ID) as Analyzed, 0 as Evaluated, 0 as Open, 0 as Closed, 0 as Rejected, 0 as Total
from SpiraTestEntities.R_Risks as RK
join SpiraTestEntities.R_RiskStatuses as RS on RK.RISK_STATUS_ID = RS.RISK_STATUS_ID
where RK.PROJECT_ID = ${ProjectId} AND RK.RISK_STATUS_NAME = 'Analyzed' and RK.IS_DELETED = False
group by RK.RISK_TYPE_NAME)
union
(select RK.RISK_TYPE_NAME, 0 as Identified, 0 as Analyzed, COUNT(RK.RISK_ID) as Evaluated, 0 as Open, 0 as Closed, 0 as Rejected, 0 as Total
from SpiraTestEntities.R_Risks as RK
join SpiraTestEntities.R_RiskStatuses as RS on RK.RISK_STATUS_ID = RS.RISK_STATUS_ID
where RK.PROJECT_ID = ${ProjectId} AND RK.RISK_STATUS_NAME = 'Evaluated' and RK.IS_DELETED = False
group by RK.RISK_TYPE_NAME)
union
(select RK.RISK_TYPE_NAME, 0 as Identified, 0 as Analyzed, 0 as Evaluated, COUNT(RK.RISK_ID) as Open, 0 as Closed, 0 as Rejected, 0 as Total
from SpiraTestEntities.R_Risks as RK
join SpiraTestEntities.R_RiskStatuses as RS on RK.RISK_STATUS_ID = RS.RISK_STATUS_ID
where RK.PROJECT_ID = ${ProjectId} AND RK.RISK_STATUS_NAME = 'Open' and RK.IS_DELETED = False
group by RK.RISK_TYPE_NAME)
union
(select RK.RISK_TYPE_NAME, 0 as Identified, 0 as Analyzed, 0 as Evaluated, 0 as Open, COUNT(RK.RISK_ID) as Closed, 0 as Rejected, 0 as Total
from SpiraTestEntities.R_Risks as RK
join SpiraTestEntities.R_RiskStatuses as RS on RK.RISK_STATUS_ID = RS.RISK_STATUS_ID
where RK.PROJECT_ID = ${ProjectId} AND RK.RISK_STATUS_NAME = 'Closed' and RK.IS_DELETED = False
group by RK.RISK_TYPE_NAME)
union
(select RK.RISK_TYPE_NAME, 0 as Identified, 0 as Analyzed, 0 as Evaluated, 0 as Open, 0 as Closed, COUNT(RK.RISK_ID) as Rejected, 0 as Total
from SpiraTestEntities.R_Risks as RK
join SpiraTestEntities.R_RiskStatuses as RS on RK.RISK_STATUS_ID = RS.RISK_STATUS_ID
where RK.PROJECT_ID = ${ProjectId} AND RK.RISK_STATUS_NAME = 'Rejected' and RK.IS_DELETED = False
group by RK.RISK_TYPE_NAME)
union
(select RK.RISK_TYPE_NAME, 0 as Identified, 0 as Analyzed, 0 as Evaluated, 0 as Open, 0 as Closed, 0 as Rejected, COUNT(RK.RISK_ID) as Total
from SpiraTestEntities.R_Risks as RK
join SpiraTestEntities.R_RiskStatuses as RS on RK.RISK_STATUS_ID = RS.RISK_STATUS_ID
where RK.PROJECT_ID = ${ProjectId} and RK.IS_DELETED = False
group by RK.RISK_TYPE_NAME)) as RA
group by RA.RISK_TYPE_NAME
order by RA.RISK_TYPE_NAME asc
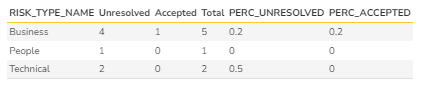
Data Output
For the query above, the data set would appear like the following.
Updating Query for Graphing
In the above query, we brought two additional %metrics that are good candidates for documenting on a report. But, we don't need to bring them in a graph as the donut chart can actually represent that. So, in the above SQL Query remove the following section in the Select Clause.
   ,
   SUM(Cast (RA.Analyzed as double)+ Cast(RA.Evaluated as double)+ Cast(RA.Open as double))/SUM(Cast (RA.Total as double)) as PERC_UNRESOLVED,
   SUM(Cast (RA.Rejected as double)+ Cast(RA.Closed as double))/SUM(Cast (RA.Total as double)) as PERC_ACCEPTED
Graph output
Given below is the output

Interpreting the Graph
- If we look at the graph, one thing is very clear. Only 20% of the identified risks have been accepted. This leaves almost 80% of the identified risks in an resolved state.
- Similarly, all identified people and technical risks are in an unresolved state.
- Is this a good picture? Only your own business process for risk management tells if this is good or not.
- But, considering almost many risks are unresolved, this begs the question of how effectively we are evaluating the risks and increasing the confidence that our product value delivery and project progress. For instance, this could involve earned value management evaluation (schedule/cost performance indices) or adaptive delivery velocity tracking (planned-to-actual commitments).