Prerequisite to Risk Evaluation
One of the critical things prior to evaluating the risks is to understand the types of unresolved risks against the risk breakdown structure. In SpiraPlan, the risk type represents the risk breakdown structure and the risk analysis article identifies those risks that are not marked as resolved or closed. It is now critical to decompose these unresolved risks according to the statuses defined in the workflow.
Some small scale organizations may actually combine analysis along with evaluation as part of the risk assessment. In such cases, the risks may be already having some probability or impact assessment done. Other organizations, such as those in a regulated industry, may do this evaluation after analyzing which risks need to be evaluated further.
Good Practice - Risk Management Life Cycle - SQL Query
Given below is a SQL Query that provides a breakdown of all the risks by the unresolved (identified, analyzed, evaluated, open) and accepted (resolved, closed).
Based on the results of the query, we can evaluate further how many unresolved risks require evaluation.
select RA.RISK_TYPE_NAME, sum(ra.identified) as identifed,
sum(ra.analyzed) as analyzed,
sum(ra.evaluated) as evaluated,
sum(ra.open) as open,
sum(ra.rejected) as rejected,
sum(ra.closed) as closed from
((select RK.RISK_TYPE_NAME, COUNT(RK.RISK_ID) as Identified, 0 as Analyzed, 0 as Evaluated, 0 as Open, 0 as Closed, 0 as Rejected, 0 as Total
from SpiraTestEntities.R_Risks as RK
join SpiraTestEntities.R_RiskStatuses as RS on RK.RISK_STATUS_ID = RS.RISK_STATUS_ID
where RK.PROJECT_ID = ${ProjectId} AND RK.RISK_STATUS_NAME = 'Identified' and RK.IS_DELETED = False
group by RK.RISK_TYPE_NAME)
union
(select RK.RISK_TYPE_NAME, 0 as Identified, COUNT(RK.RISK_ID) as Analyzed, 0 as Evaluated, 0 as Open, 0 as Closed, 0 as Rejected, 0 as Total
from SpiraTestEntities.R_Risks as RK
join SpiraTestEntities.R_RiskStatuses as RS on RK.RISK_STATUS_ID = RS.RISK_STATUS_ID
where RK.PROJECT_ID = ${ProjectId} AND RK.RISK_STATUS_NAME = 'Analyzed' and RK.IS_DELETED = False
group by RK.RISK_TYPE_NAME)
union
(select RK.RISK_TYPE_NAME, 0 as Identified, 0 as Analyzed, COUNT(RK.RISK_ID) as Evaluated, 0 as Open, 0 as Closed, 0 as Rejected, 0 as Total
from SpiraTestEntities.R_Risks as RK
join SpiraTestEntities.R_RiskStatuses as RS on RK.RISK_STATUS_ID = RS.RISK_STATUS_ID
where RK.PROJECT_ID = ${ProjectId} AND RK.RISK_STATUS_NAME = 'Evaluated' and RK.IS_DELETED = False
group by RK.RISK_TYPE_NAME)
union
(select RK.RISK_TYPE_NAME, 0 as Identified, 0 as Analyzed, 0 as Evaluated, COUNT(RK.RISK_ID) as Open, 0 as Closed, 0 as Rejected, 0 as Total
from SpiraTestEntities.R_Risks as RK
join SpiraTestEntities.R_RiskStatuses as RS on RK.RISK_STATUS_ID = RS.RISK_STATUS_ID
where RK.PROJECT_ID = ${ProjectId} AND RK.RISK_STATUS_NAME = 'Open' and RK.IS_DELETED = False
group by RK.RISK_TYPE_NAME)
union
(select RK.RISK_TYPE_NAME, 0 as Identified, 0 as Analyzed, 0 as Evaluated, 0 as Open, COUNT(RK.RISK_ID) as Closed, 0 as Rejected, 0 as Total
from SpiraTestEntities.R_Risks as RK
join SpiraTestEntities.R_RiskStatuses as RS on RK.RISK_STATUS_ID = RS.RISK_STATUS_ID
where RK.PROJECT_ID = ${ProjectId} AND RK.RISK_STATUS_NAME = 'Closed' and RK.IS_DELETED = False
group by RK.RISK_TYPE_NAME)
union
(select RK.RISK_TYPE_NAME, 0 as Identified, 0 as Analyzed, 0 as Evaluated, 0 as Open, 0 as Closed, COUNT(RK.RISK_ID) as Rejected, 0 as Total
from SpiraTestEntities.R_Risks as RK
join SpiraTestEntities.R_RiskStatuses as RS on RK.RISK_STATUS_ID = RS.RISK_STATUS_ID
where RK.PROJECT_ID = ${ProjectId} AND RK.RISK_STATUS_NAME = 'Rejected' and RK.IS_DELETED = False
group by RK.RISK_TYPE_NAME)
union
(select RK.RISK_TYPE_NAME, 0 as Identified, 0 as Analyzed, 0 as Evaluated, 0 as Open, 0 as Closed, 0 as Rejected, COUNT(RK.RISK_ID) as Total
from SpiraTestEntities.R_Risks as RK
join SpiraTestEntities.R_RiskStatuses as RS on RK.RISK_STATUS_ID = RS.RISK_STATUS_ID
where RK.PROJECT_ID = ${ProjectId} and RK.IS_DELETED = False
group by RK.RISK_TYPE_NAME)) as RA
group by RA.RISK_TYPE_NAME
Query Explanation
- This query builds a lot of subqueries and then summarizes them in the external query.
- Each subquery is counting the number of risks that are in a specific risk status by the risk status name.
- The combination of all these subqueries build a matrix of risk types with columns representing the count of risks for every risk status and the total risks for the risk type.
- The external query summarizes this tabular data for further review.
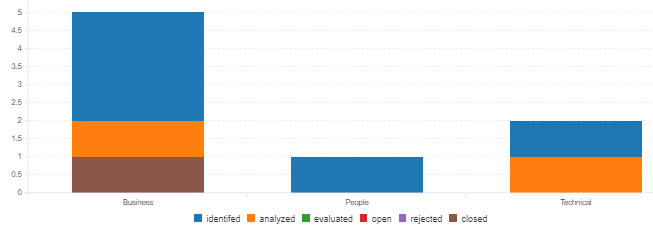
Output
Good Practice - Graph Interpretation
- In this above example, we have three risk types (more RBS categories, more risk types). Within this, it is preferable to have lower percentage of risks in the early stages of risk management. This means the risk management process is efficient because fewer risks are in the identified or analyzed state. It is possible to have more risks in the evaluated or open stage alone as these are active risks that need a risk response. These are the risks that need to be constantly monitored so that they are moved to the closed or rejected states.
- In our illustration, we see that only 1 of the 5 available (20%) business types is in a closed state. While that itself is not bad, we see that only 1 of the remaining risks (another 20%) is in the analyzed state. As we know, more they are in the evaluated and open, the better. What is more risky here is that 60% (3 of the 5 risks) of the business risks are identified but not analyzed.
- Similar logic applies to people related risks where the 1 identified risk is not addressed at all (100% risk issue).
- The situation may appear better for technical risks but in reality it is bad because 50% of the risks are in both the identified and analyzed.
- As we look at these risks, it is also possible for people to focus only on the identified things. But, if you have a risk type such as procurement or quality risk and there is not even any risks identified, this could be an indicate of more important problems not being addressed at all. So, while focusing on just the data in the graph is important, it is also important to focus on what's not on the graph that should be on the graph.