Overview
How do you create a custom report that displays risks and a historical view of how their exposure score (the sum of their probability and impact) has changed over time?
To do this we get both Exposure values (old and new) - for the particular date.
Writing the SQL Query
- Follow the reference link "Custom Report Tutorial" to create a new Report
- Use the below SQL Query
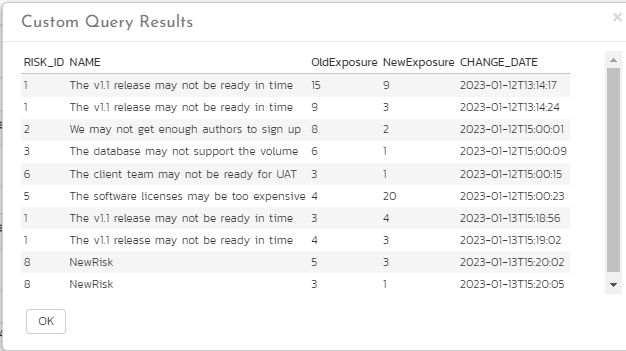
- Click on "Preview Results" to check the results
- If the results are satisfactory, click on Create Default Template
SQL Query
Use the following Entity SQL as a custom section:
select RK.RISK_ID, RK.NAME, HD.OLD_VALUE_INT AS OldExposure, HD.New_VALUE_INT AS NewExposure,  HD.CHANGE_DATE
from SpiraTestEntities.R_Risks as RK
INNER JOIN SpiraTestEntities.R_HISTORYDETAILS AS HD ON RK.RISK_ID=HD.ARTIFACT_ID
where RK.PROJECT_ID = ${ProjectId}
AND HD.FIELD_NAME = '_RiskExposure'
Preview Results window will display a a select number of items:
Report Template
To display the full list of filtered items, click "Create Default Template" and then click "Save" twice. This report will look very similar to the preview results above.
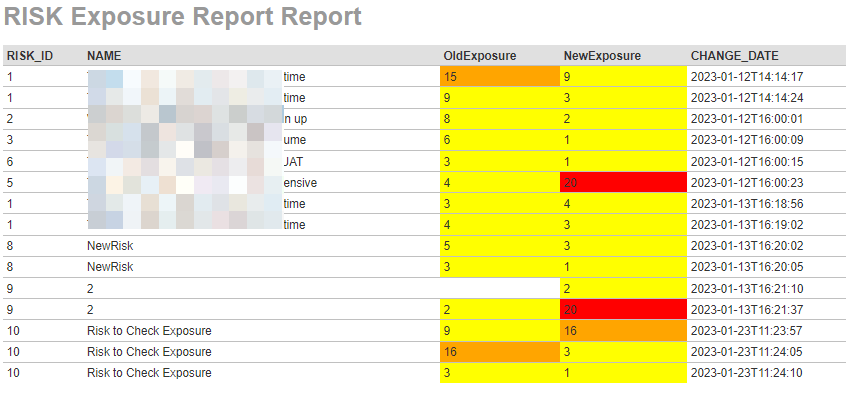
However, we can modify the report template with some additional logic:
- If the Risk Exposure is > 0 and < 10, it will be shaded yellow.
- If the Risk Exposure is >= 10 and < 20, it will be shaded orange.
- If the Risk Exposure is >= 20, it will be shaded red.
Click Save on the popup, and Save on the main report page.
The report is now ready to use.
<?xml version="1.0" encoding="utf-8"?>
<xsl:stylesheet version="1.0" xmlns:xsl="http://www.w3.org/1999/XSL/Transform" xmlns:msxsl="urn:schemas-microsoft-com:xslt" exclude-result-prefixes="msxsl">
<xsl:template match="/RESULTS">
<table class="DataGrid">
<tr>
<th>RISK_ID</th>
<th>NAME</th>
<th>OldExposure</th>
<th>NewExposure</th>
<th>CHANGE_DATE</th>
</tr>
<xsl:for-each select="ROW">
<tr>
<td>
<xsl:value-of select="RISK_ID"/>
</td>
<td>
<xsl:value-of select="NAME"/>
</td>
<xsl:choose>
<xsl:when test="OldExposure > 0 and OldExposure < 10">
<td style="background-color: yellow">
<xsl:value-of select="OldExposure"/></td>
</xsl:when>
<xsl:when test="OldExposure >= 10 and OldExposure < 20">
<td style="background-color: orange">
<xsl:value-of select="OldExposure"/></td>
</xsl:when>
<xsl:when test="OldExposure >= 20">
<td style="background-color: red">
<xsl:value-of select="OldExposure"/></td>
</xsl:when>
<xsl:otherwise>
<td>
<xsl:value-of select="OldExposure"/>
</td>
</xsl:otherwise>
</xsl:choose>
<xsl:choose>
<xsl:when test="NewExposure > 0 and NewExposure < 10">
<td style="background-color: yellow">
<xsl:value-of select="NewExposure"/></td>
</xsl:when>
<xsl:when test="NewExposure >= 10 and NewExposure < 20">
<td style="background-color: orange">
<xsl:value-of select="NewExposure"/></td>
</xsl:when>
<xsl:when test="NewExposure >= 20">
<td style="background-color: red">
<xsl:value-of select="NewExposure"/></td>
</xsl:when>
<xsl:otherwise>
<td>
<xsl:value-of select="NewExposure"/>
</td>
</xsl:otherwise>
</xsl:choose>
<td>
<xsl:value-of select="CHANGE_DATE"/>
</td>
</tr>
</xsl:for-each>
</table>
</xsl:template>
</xsl:stylesheet>
Running the Report
Now that you have created the report, go to the main Reports tab and choose to run the report in one of the supported formats.
You will now see the following: