Setting Up the Test Cases and Configurations
The first thing to do is to setup the necessary test cases with parameters and include in the first step a Sample Data column that contains the parameters that are going to be used in a simple to read format:
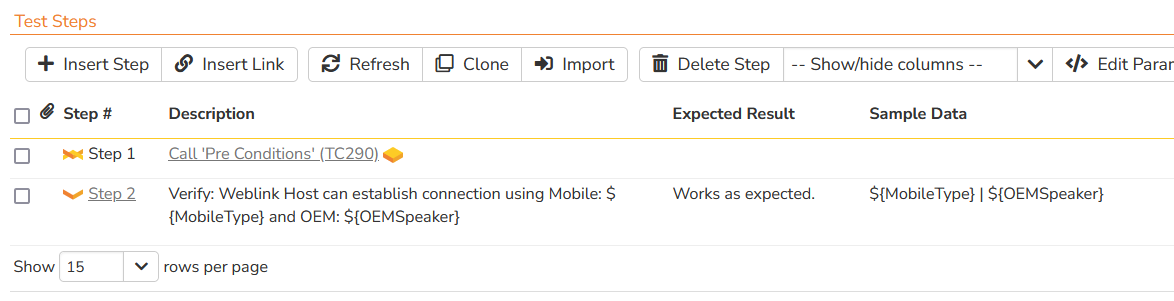
For example, here we have defined the parameters for a type of mobile phone and speaker:
${MobileType} | ${OEMSpeaker}We should then do the same thing for all the other test cases that will be executed.
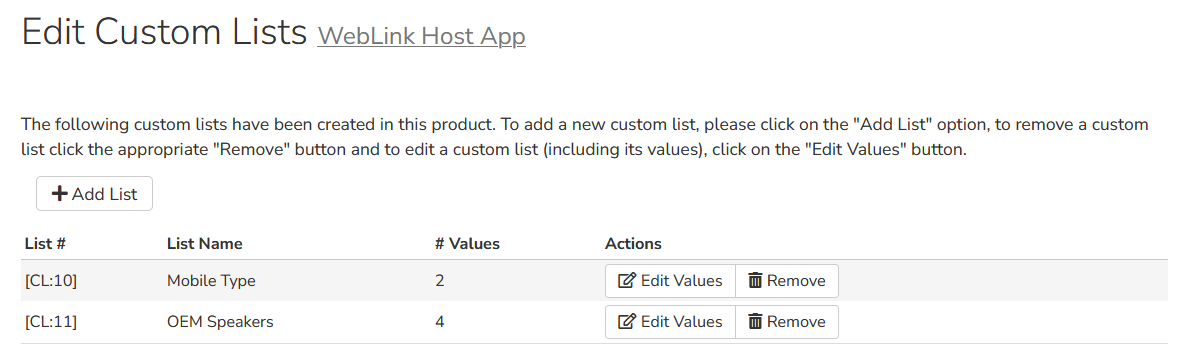
Next, we will populate custom properties for the different choices of mobile phone and speaker:
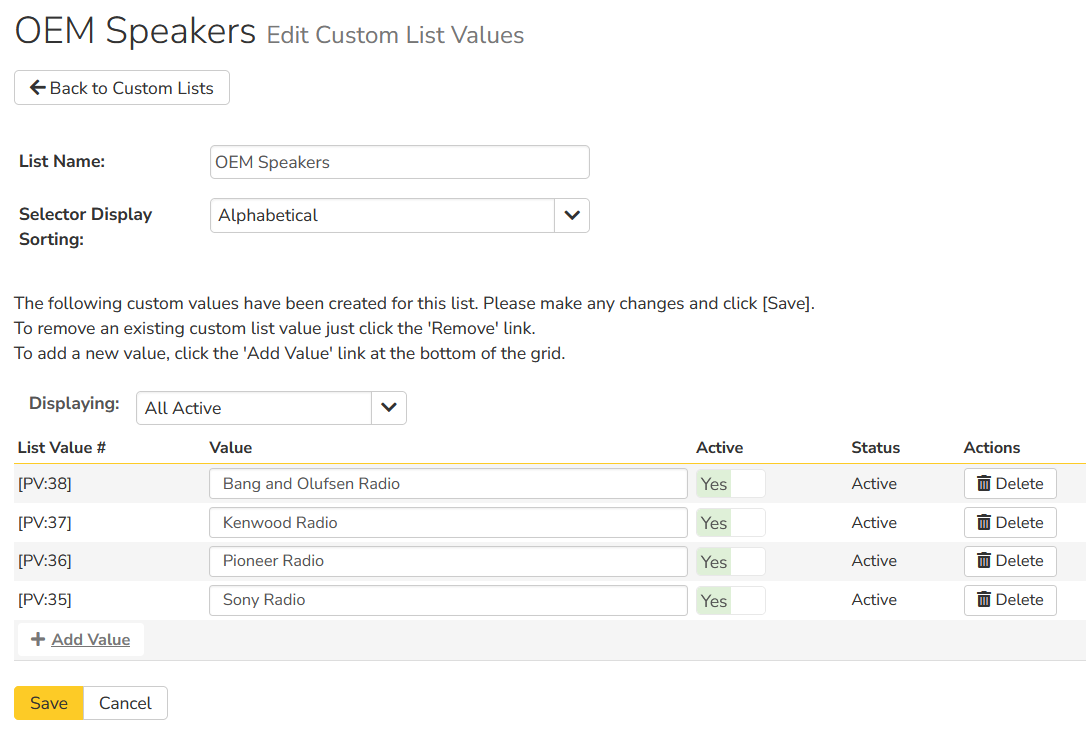
Each of these custom properties and lists will contain a set of possible values. For example, the list of speakers might look like:
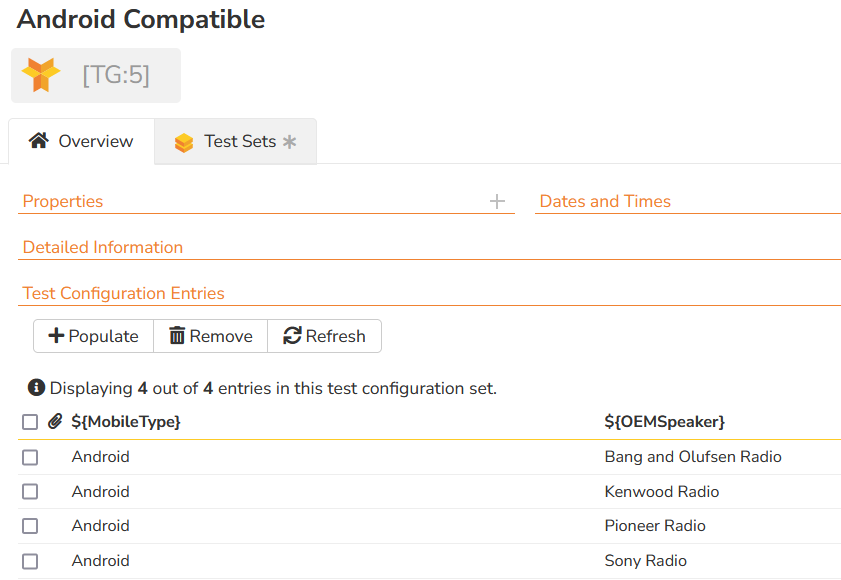
Finally, we can generate the test configuration set using the defined parameters and list of possible values:
Scheduling the Tests in Test Sets
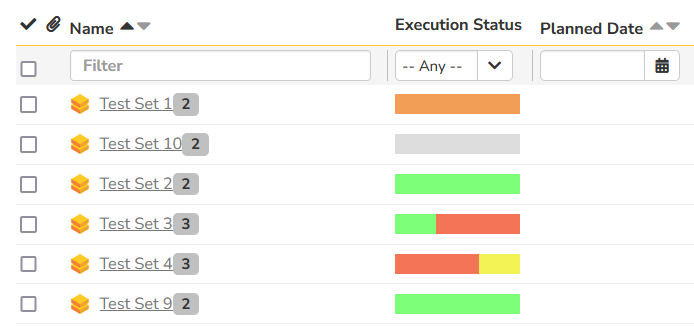
Now that we have the test cases, parameters and configuration sets defined, we can put them together into a series of test sets that we can execute:
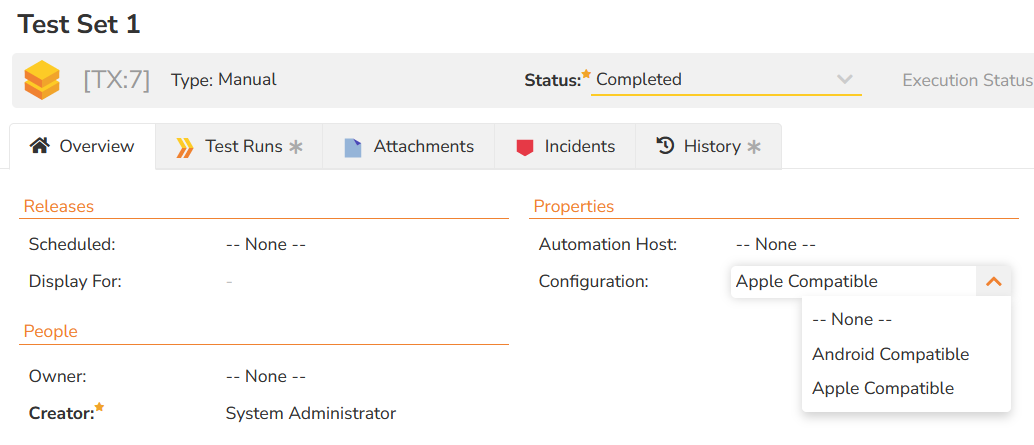
If we look at one of the test sets, we can see how we have mapped it to a specific test configuration:
Now the tester is ready to execute the test set, which will create one unique test run for each of the test configuration permutations in the set:

So the question is, how do we correlate the results by test configuration?
That is where the custom report comes in.
Creating the Test Configuration Custom Report
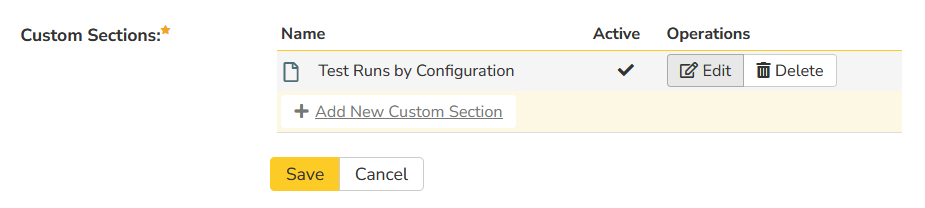
This section assumes you know how to create a new custom report in Spira, as described in this guide. Create a new Custom Report and choose the option to add a new Custom Section:
In the custom section, choose a name such as "Test Runs by Configuration" and then enter the following ESQL query:
select
	TR.RELEASE_VERSION_NUMBER,
    TR.TEST_SET_NAME,
    TRS.SAMPLE_DATA,
    sum(CASE WHEN TR.EXECUTION_STATUS_NAME = 'Passed' THEN 1 ELSE 0 END) as PASSED_COUNT,
    sum(CASE WHEN TR.EXECUTION_STATUS_NAME = 'Failed' THEN 1 ELSE 0 END) as FAILED_COUNT,
    sum(CASE WHEN TR.EXECUTION_STATUS_NAME = 'Caution' THEN 1 ELSE 0 END) as CAUTION_COUNT
from SpiraTestEntities.R_TestRuns as TR
	join SpiraTestEntities.R_TestRunSteps as TRS on TR.TEST_RUN_ID = TRS.TEST_RUN_ID
where
	TR.PROJECT_ID = ${ProjectId}
	and TRS.SAMPLE_DATA IS NOT NULL
group by
	TR.RELEASE_VERSION_NUMBER,
	TR.TEST_SET_NAME,
	TRS.SAMPLE_DATA
For the XSLT template, instead of using the option to auto-generate, use this template instead:
<?xml version="1.0" encoding="utf-8"?>
<xsl:stylesheet version="1.0" xmlns:xsl="http://www.w3.org/1999/XSL/Transform" xmlns:msxsl="urn:schemas-microsoft-com:xslt" exclude-result-prefixes="msxsl">
  <xsl:template match="/RESULTS">
    <table class="DataGrid">
		<tr>
			<th>Release #</th>
			<th>Test Set</th>
			<th>Configuration</th>
			<th># Tests Passed</th>
			<th># Tests Failed</th>
			<th># Tests Caution</th>
			<th>Graph</th>
		</tr>
		<xsl:for-each select="ROW">
			<tr>
				<td><xsl:value-of select="RELEASE_VERSION_NUMBER"/></td>
				<td><xsl:value-of select="TEST_SET_NAME"/></td>
				<td><xsl:value-of select="SAMPLE_DATA" disable-output-escaping="yes" /></td>
				<td><xsl:value-of select="PASSED_COUNT"/></td>
				<td><xsl:value-of select="FAILED_COUNT"/></td>
				<td><xsl:value-of select="CAUTION_COUNT"/></td>
				<td>
					<div>
						<xsl:attribute name="style">display:inline-block; background-color:lime; height: 20px; width:<xsl:value-of select="PASSED_COUNT * 100 div (PASSED_COUNT + FAILED_COUNT + CAUTION_COUNT)"/>px</xsl:attribute>
					</div>
					<div>
						<xsl:attribute name="style">display:inline-block; background-color:red; height: 20px; width:<xsl:value-of select="FAILED_COUNT * 100 div (PASSED_COUNT + FAILED_COUNT + CAUTION_COUNT)"/>px</xsl:attribute>
					</div>
					<div>
						<xsl:attribute name="style">display:inline-block; background-color:orange; height: 20px; width:<xsl:value-of select="CAUTION_COUNT * 100 div (PASSED_COUNT + FAILED_COUNT + CAUTION_COUNT)"/>px</xsl:attribute>
					</div>
				</td>
			</tr>
	    </xsl:for-each>
	</table>
  </xsl:template>
</xsl:stylesheet>
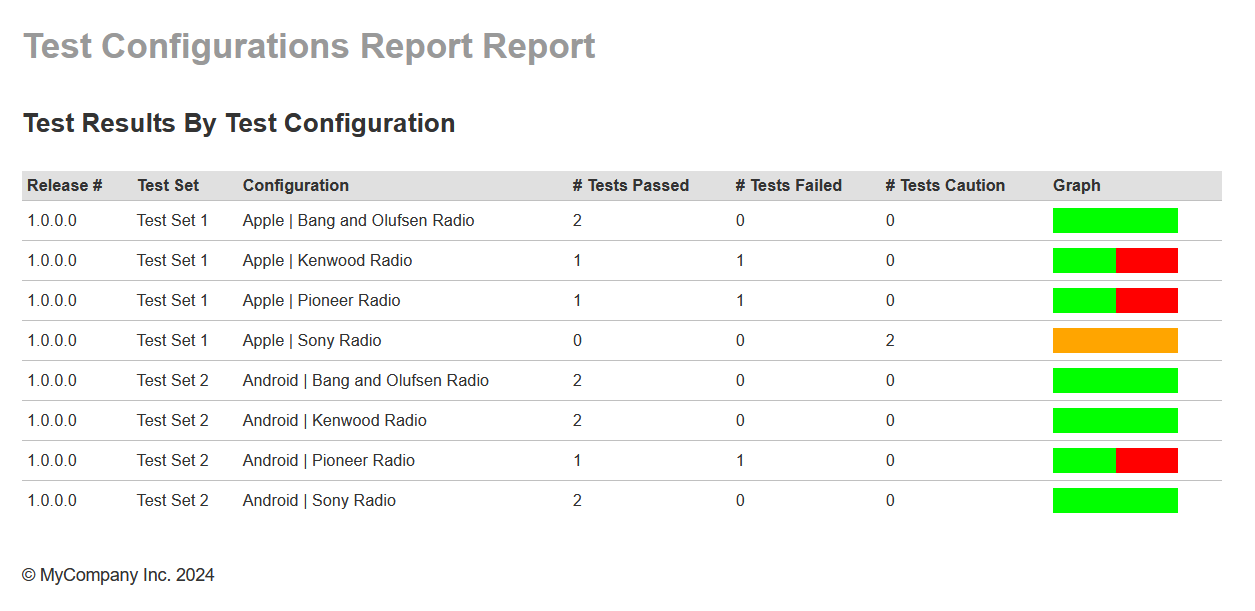
When you run the new custom report, you will see a table like the following: