Creating the Custom Report
The following custom report can be used to generate a table of requirements along with the number of suspect test cases associated with them.
select RT.REQUIREMENT_ID, RT.REQUIREMENT_NAME, count(TC.TEST_CASE_ID) as SUSPECT_COUNT
from SpiraTestEntities.R_RequirementTestCases as RT
join SpiraTestEntities.R_TestCases as TC on RT.TEST_CASE_ID = TC.TEST_CASE_ID
where RT.PROJECT_ID = ${ProjectId} and TC.IS_DELETED = False and TC.IS_SUSPECT = True
group by RT.REQUIREMENT_ID, RT.REQUIREMENT_NAME
Then the following report template can be used to display the table:
<?xml version="1.0" encoding="utf-8"?>
<xsl:stylesheet version="1.0" xmlns:xsl="http://www.w3.org/1999/XSL/Transform" xmlns:msxsl="urn:schemas-microsoft-com:xslt" exclude-result-prefixes="msxsl">
  <xsl:template match="/RESULTS">
    <table class="DataGrid"><tr><th>Requirement ID</th><th>Requirement Name</th><th># Suspect Test Cases</th></tr>
      <xsl:for-each select="ROW">
        <tr><td>RQ:<xsl:value-of select="REQUIREMENT_ID"/></td><td><xsl:value-of select="REQUIREMENT_NAME"/></td><td><xsl:value-of select="SUSPECT_COUNT"/></td>
        </tr>
      </xsl:for-each>
        </table>
    </xsl:template>
</xsl:stylesheet>
Executing the Report
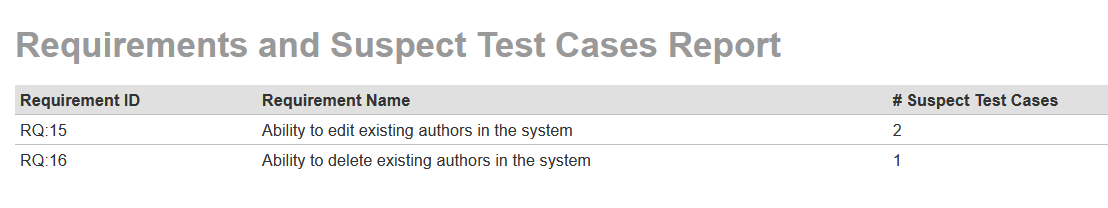
When you run the report in the sample project after you have modified several requirements linked to already approved test cases, you will see the following:
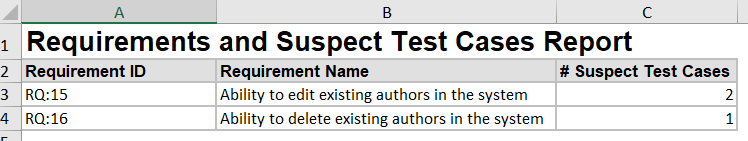
or if you want to export to Excel: