Creating the Custom Report
The following custom report can be used to generate a table of incidents (defects) along with the number of times each one has been reopened:
select
  HC.ARTIFACT_ID as INCIDENT_ID,
  HC.ARTIFACT_DESC as INCIDENT_NAME,
  count(HC.CHANGESET_ID) as REOPEN_COUNT
from SpiraTestEntities.R_HistoryChangeSets as HC
inner join SpiraTestEntities.R_HistoryDetails as HD on HC.CHANGESET_ID = HD.CHANGESET_ID
where
  HD.FIELD_NAME = 'IncidentStatusId' and
  HC.ARTIFACT_TYPE_ID = 3 and
  HD.NEW_VALUE = 'Reopen' and
  HC.PROJECT_ID = ${ProjectId}
group by HC.ARTIFACT_ID, HC.ARTIFACT_DESC
order by REOPEN_COUNT desc
Then the following report template can be used to display the table:
<?xml version="1.0" encoding="utf-8"?>
<xsl:stylesheet version="1.0" xmlns:xsl="http://www.w3.org/1999/XSL/Transform" xmlns:msxsl="urn:schemas-microsoft-com:xslt" exclude-result-prefixes="msxsl">
  <xsl:template match="/RESULTS">
    <table class="DataGrid"><tr><th>Incident Id</th><th>Name</th><th>Reopen Count</th></tr>
      <xsl:for-each select="ROW">
        <tr><td>IN:<xsl:value-of select="INCIDENT_ID"/></td><td><xsl:value-of select="INCIDENT_NAME"/></td><td><xsl:value-of select="REOPEN_COUNT"/></td>
        </tr>
      </xsl:for-each>
        </table>
    </xsl:template>
</xsl:stylesheet>
Executing the Report
When you run the report in a product that has several defects that have been reopened, you will see the following:
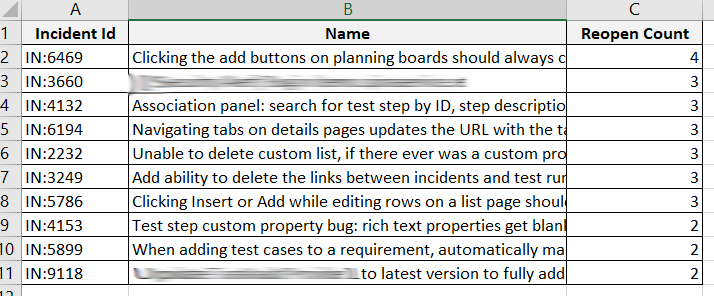
The list of defects is displayed, along with the reopen count, in descending order.
To get a graph of the number of defects in each reopen count interval (1,2,3,4) you could simply use an Excel graph, but using Spira's custom graphing feature, you can do it entirely within the application:
Creating the Graph
First, you need to create a Custom Graph :
- Go to Administration > Edit Graphs
- Click Add New Custom Graph
- Specify that it applies to the Product.
- Insert the ESQL query into the Query section
(select 1 as ReopenCount, count (XZ.INCIDENT_ID) as IncidentCount from
(select
  HC.ARTIFACT_ID as INCIDENT_ID,
  count(HC.CHANGESET_ID) as REOPEN_COUNT
from SpiraTestEntities.R_HistoryChangeSets as HC
inner join SpiraTestEntities.R_HistoryDetails as HD on HC.CHANGESET_ID = HD.CHANGESET_ID
where
  HD.FIELD_NAME = 'IncidentStatusId' and
  HC.ARTIFACT_TYPE_ID = 3 and
  HD.NEW_VALUE = 'Reopen' and
  HC.PROJECT_ID = ${ProjectId}
group by HC.ARTIFACT_ID, HC.ARTIFACT_DESC) as XZ
where XZ.REOPEN_COUNT = 1)
union
(select 2 as ReopenCount, count (XZ.INCIDENT_ID) as IncidentCount from
(select
  HC.ARTIFACT_ID as INCIDENT_ID,
  count(HC.CHANGESET_ID) as REOPEN_COUNT
from SpiraTestEntities.R_HistoryChangeSets as HC
inner join SpiraTestEntities.R_HistoryDetails as HD on HC.CHANGESET_ID = HD.CHANGESET_ID
where
  HD.FIELD_NAME = 'IncidentStatusId' and
  HC.ARTIFACT_TYPE_ID = 3 and
  HD.NEW_VALUE = 'Reopen' and
  HC.PROJECT_ID = ${ProjectId}
group by HC.ARTIFACT_ID, HC.ARTIFACT_DESC) as XZ
where XZ.REOPEN_COUNT = 2)
union
(select 3 as ReopenCount, count (XZ.INCIDENT_ID) as IncidentCount from
(select
  HC.ARTIFACT_ID as INCIDENT_ID,
  count(HC.CHANGESET_ID) as REOPEN_COUNT
from SpiraTestEntities.R_HistoryChangeSets as HC
inner join SpiraTestEntities.R_HistoryDetails as HD on HC.CHANGESET_ID = HD.CHANGESET_ID
where
  HD.FIELD_NAME = 'IncidentStatusId' and
  HC.ARTIFACT_TYPE_ID = 3 and
  HD.NEW_VALUE = 'Reopen' and
  HC.PROJECT_ID = ${ProjectId}
group by HC.ARTIFACT_ID, HC.ARTIFACT_DESC) as XZ
where XZ.REOPEN_COUNT = 3)
union
(select 4 as ReopenCount, count (XZ.INCIDENT_ID) as IncidentCount from
(select
  HC.ARTIFACT_ID as INCIDENT_ID,
  count(HC.CHANGESET_ID) as REOPEN_COUNT
from SpiraTestEntities.R_HistoryChangeSets as HC
inner join SpiraTestEntities.R_HistoryDetails as HD on HC.CHANGESET_ID = HD.CHANGESET_ID
where
  HD.FIELD_NAME = 'IncidentStatusId' and
  HC.ARTIFACT_TYPE_ID = 3 and
  HD.NEW_VALUE = 'Reopen' and
  HC.PROJECT_ID = ${ProjectId}
group by HC.ARTIFACT_ID, HC.ARTIFACT_DESC) as XZ
where XZ.REOPEN_COUNT = 4)
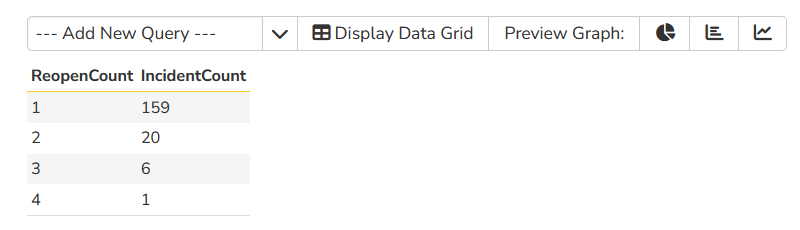
When you preview the graph data, you will see:
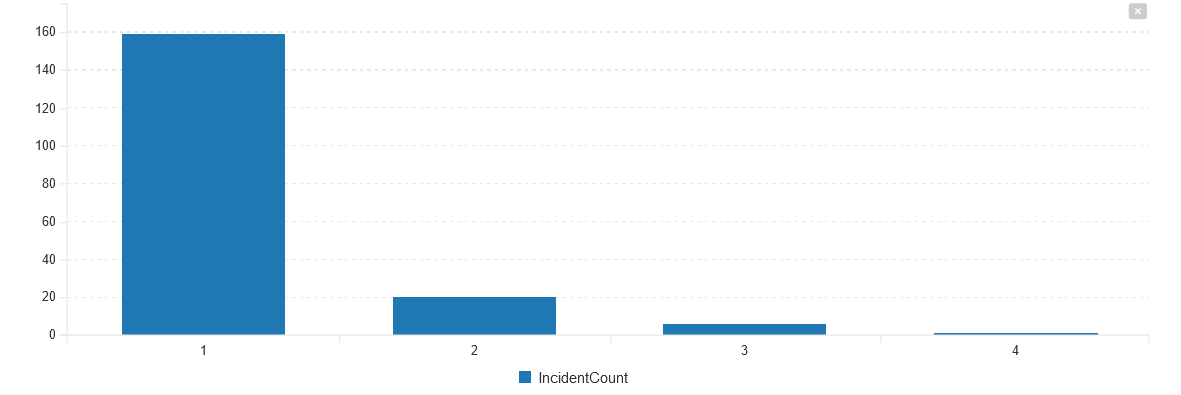
Finally, you can now display the following bar graph of the number of incidents (defects) that have been opened one or more times:
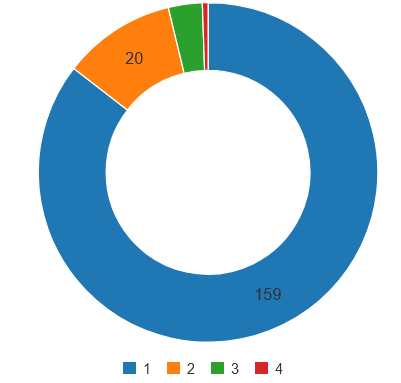
You can also choose the donut chart visualization if that is preferable: