Overview
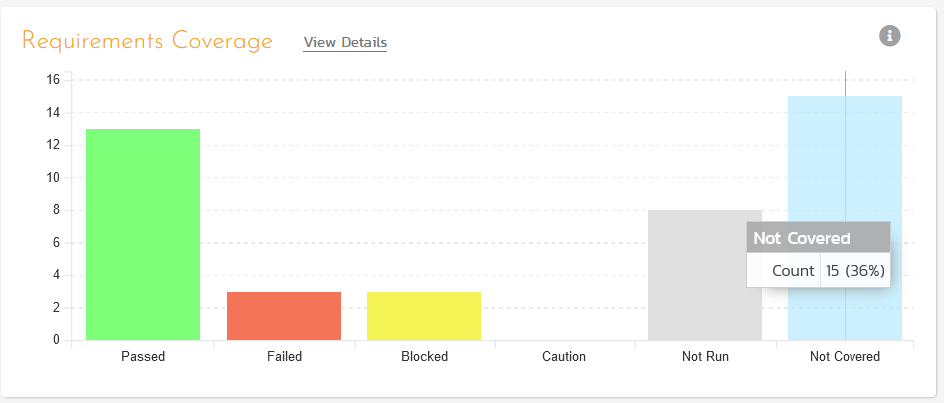
Inside SpiraTest, there is the following built-in graph that has tooltips showing the raw data:
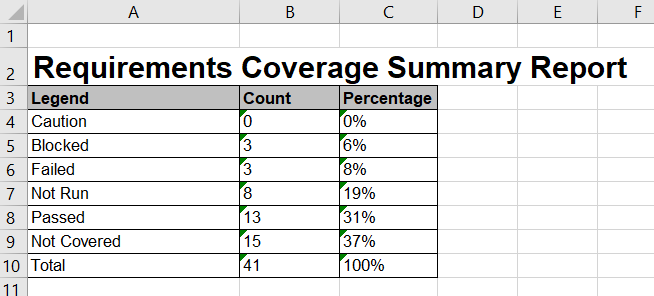
Sometimes you would like to have the same data in an raw format such as Excel, or you would like to view the raw metrics in numerical form. Never fear, custom reporting is here!
Custom Report
Using the SpiraTest custom reporting functionality, use the following Entity SQL query:
(select 'Total' as Legend, count(RQ.REQUIREMENT_ID) as Count
from SpiraTestEntities.R_Requirements as RQ
where RQ.PROJECT_ID = ${ProjectId} and RQ.IS_DELETED = False)
union
(select 'Not Covered' as Legend, count(RQ.REQUIREMENT_ID) as Count
from SpiraTestEntities.R_Requirements as RQ
where RQ.PROJECT_ID = ${ProjectId} and RQ.IS_DELETED = False and RQ.COVERAGE_COUNT_TOTAL = 0)
union
(select 'Not Run' as Legend, sum(cast (RQ.COVERAGE_COUNT_TOTAL - RQ.COVERAGE_COUNT_PASSED - RQ.COVERAGE_COUNT_FAILED - RQ.COVERAGE_COUNT_BLOCKED - RQ.COVERAGE_COUNT_CAUTION as double) / cast(RQ.COVERAGE_COUNT_TOTAL as double)) as Count
from SpiraTestEntities.R_Requirements as RQ
where RQ.PROJECT_ID = ${ProjectId} and RQ.IS_DELETED = False and RQ.COVERAGE_COUNT_TOTAL > 0)
union
(select 'Passed' as Legend, sum(cast (RQ.COVERAGE_COUNT_PASSED as double) / cast(RQ.COVERAGE_COUNT_TOTAL as double)) as Count
from SpiraTestEntities.R_Requirements as RQ
where RQ.PROJECT_ID = ${ProjectId} and RQ.IS_DELETED = False and RQ.COVERAGE_COUNT_TOTAL > 0)
union
(select 'Failed' as Legend, sum(cast (RQ.COVERAGE_COUNT_FAILED as double) / cast(RQ.COVERAGE_COUNT_TOTAL as double)) as Count
from SpiraTestEntities.R_Requirements as RQ
where RQ.PROJECT_ID = ${ProjectId} and RQ.IS_DELETED = False and RQ.COVERAGE_COUNT_TOTAL > 0)
union
(select 'Blocked' as Legend, sum(cast (RQ.COVERAGE_COUNT_BLOCKED as double) / cast(RQ.COVERAGE_COUNT_TOTAL as double)) as Count
from SpiraTestEntities.R_Requirements as RQ
where RQ.PROJECT_ID = ${ProjectId} and RQ.IS_DELETED = False and RQ.COVERAGE_COUNT_TOTAL > 0)
union
(select 'Caution' as Legend, sum(cast (RQ.COVERAGE_COUNT_CAUTION as double) / cast(RQ.COVERAGE_COUNT_TOTAL as double)) as Count
from SpiraTestEntities.R_Requirements as RQ
where RQ.PROJECT_ID = ${ProjectId} and RQ.IS_DELETED = False and RQ.COVERAGE_COUNT_TOTAL > 0)
then add the following XSTL report template:
<?xml version="1.0" encoding="utf-8"?>
<xsl:stylesheet version="1.0" xmlns:xsl="http://www.w3.org/1999/XSL/Transform" xmlns:msxsl="urn:schemas-microsoft-com:xslt" exclude-result-prefixes="msxsl">
  <xsl:template match="/RESULTS">
    <table class="DataGrid"><tr><th>Legend</th><th>Count</th><th>Percentage</th></tr>
      <xsl:for-each select="ROW">
        <tr>
           <td><xsl:value-of select="Legend"/></td>
           <td><xsl:value-of select="round(Count)"/></td>
           <td><xsl:value-of select="round((Count div ../ROW[Legend='Total']/Count) * 100)"/>%</td>
        </tr>
      </xsl:for-each>
        </table>
    </xsl:template>
</xsl:stylesheet>
when you put them together, and run the report, you will see the following output:
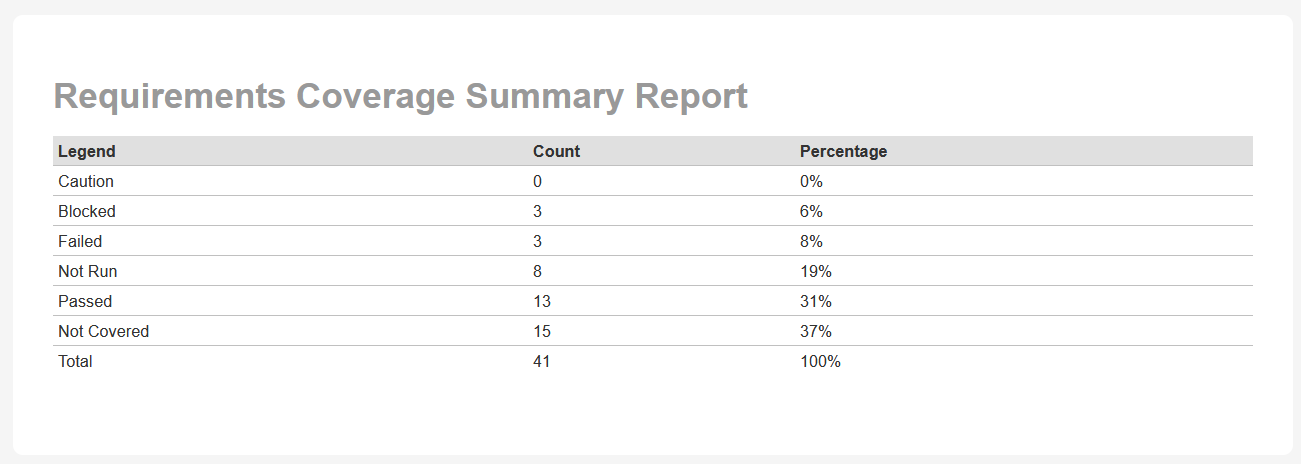
(you can change it to use rounding vs. truncation if you want to get the same 36% as in the built-in graph, but rounding is more accurate)
You can then generate this data in Excel format as well: