Background
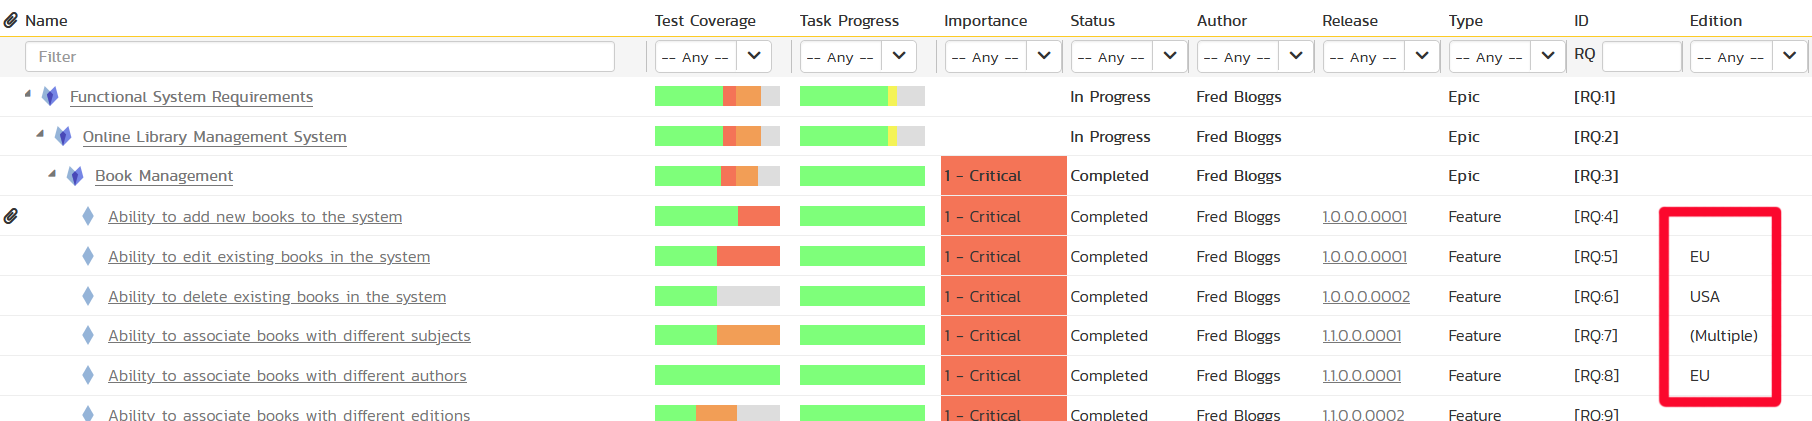
In this example, we have added a multi-select list custom property to requirements for tracking whether a requirement is being delivered to:
- The USA edition of our product
- The EU edition of product
- Both editions of the product
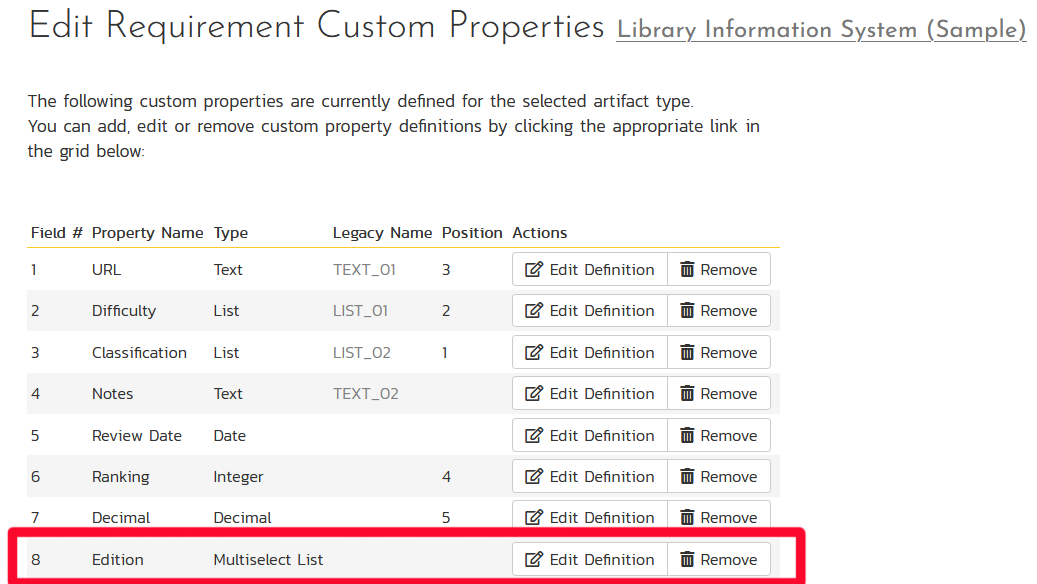
So, we add a multi-select custom property to requirements (in this case in position 08):
Once we have added this property, we now assign some values for this property to some of our requirements:
Now we can go ahead and actually write the custom report query.
The Entity SQL Query
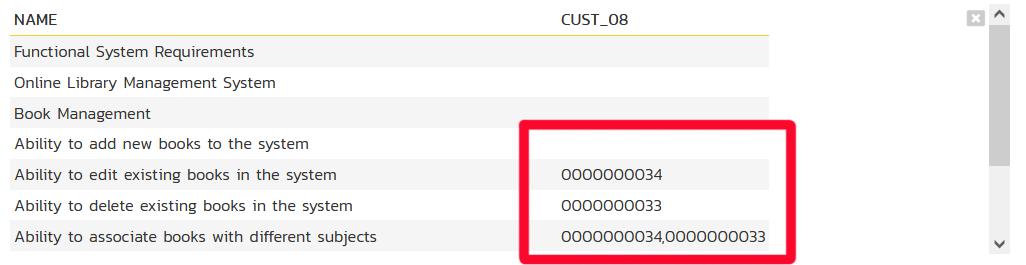
The one challenge in writing the custom graph ESQL query is that the multi-select custom properties in Spira are stored as comma-separated strings. For example, if you run the following general query to return the custom field, you'll see what I mean:
select R.NAME, R.CUST_08 from SpiraTestEntities.R_Requirements as R where R.PROJECT_ID = ${ProjectId}
This will display the name of the requirement along with the value of the new custom property:
So what we need to do is create a query that joins that comma-separated list of ID values onto the list of Editions (USA vs. EU) so that it displays the display name of the custom property not its internal ID. Thanks to one of our customers, we have the following query that uses a special Contains, EndsWith and StartsWith set of functions to do this join correctly:
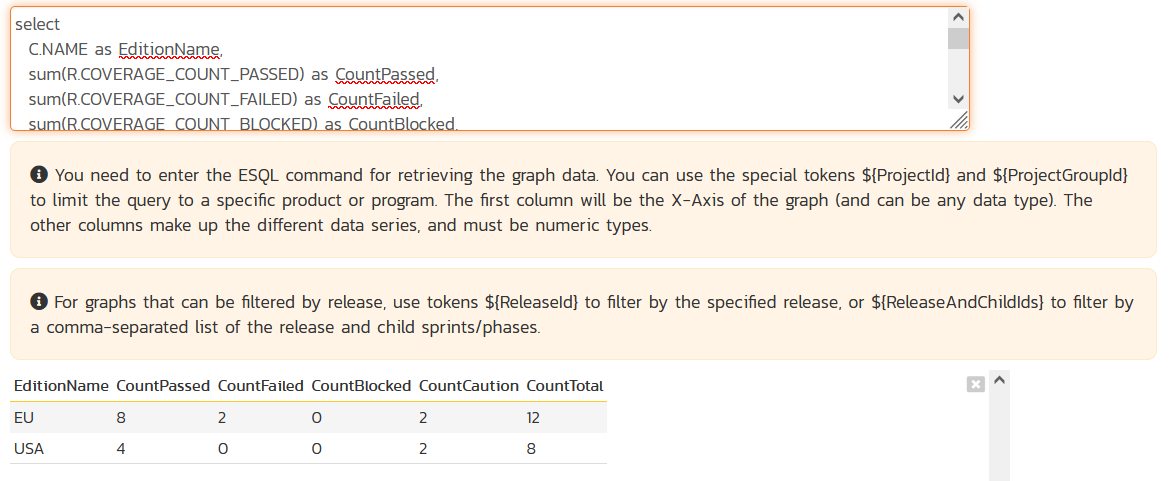
select
  C.NAME as EditionName,
  R.COVERAGE_COUNT_PASSED as CountPassed,
  R.COVERAGE_COUNT_FAILED as CountFailed,
  R.COVERAGE_COUNT_BLOCKED as CountBlocked,
  R.COVERAGE_COUNT_CAUTION as CountCaution,
  R.COVERAGE_COUNT_TOTAL as CountTotal
from SpiraTestEntities.R_Requirements as R
inner join SpiraTestEntities.R_CustomListValues as C
  on Contains(R.CUST_08, Concat(Concat('0', CAST(C.CUSTOM_PROPERTY_VALUE_ID as Edm.String)), ','))
  or EndsWith(R.CUST_08, Concat('0', CAST(C.CUSTOM_PROPERTY_VALUE_ID as Edm.String)))
  or StartsWith(R.CUST_08, CAST(C.CUSTOM_PROPERTY_VALUE_ID as Edm.String))
where R.PROJECT_ID = ${ProjectId}
  and R.IS_DELETED = False
Now we just need to add the Grouping by Edition Name to get the final query that we can use in our custom graph:
select
  C.NAME as EditionName,
  sum(R.COVERAGE_COUNT_PASSED) as CountPassed,
  sum(R.COVERAGE_COUNT_FAILED) as CountFailed,
  sum(R.COVERAGE_COUNT_BLOCKED) as CountBlocked,
  sum(R.COVERAGE_COUNT_CAUTION) as CountCaution,
  sum(R.COVERAGE_COUNT_TOTAL) as CountTotal
from SpiraTestEntities.R_Requirements as R
inner join SpiraTestEntities.R_CustomListValues as C
  on Contains(R.CUST_08, Concat(Concat('0', CAST(C.CUSTOM_PROPERTY_VALUE_ID as Edm.String)), ','))
  or EndsWith(R.CUST_08, Concat('0', CAST(C.CUSTOM_PROPERTY_VALUE_ID as Edm.String)))
  or StartsWith(R.CUST_08, CAST(C.CUSTOM_PROPERTY_VALUE_ID as Edm.String))
where R.PROJECT_ID = ${ProjectId}
  and R.IS_DELETED = False
group by C.NAME
Note that we're using the COVERAGE_COUNT_XXXXX fields to get the count of test cases in each status associated with the requirement. We're also excluding any deleted requirements using this special clause:
R.IS_DELETED = False
Viewing the Data and Final Graph
Now that we have completed our query, when we enter it into the Spira custom graph wizard we can click the Display Data Grid to preview how the data will look:
Finally we can preview and publish the graph as a Bar Chart:
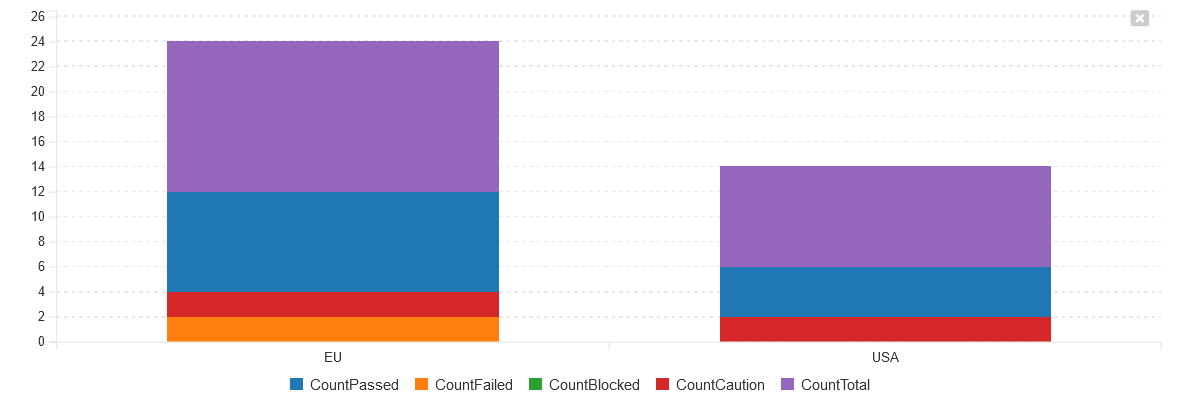
Voila, we now have a custom graph that shows the count of test coverage by requirement edition.