Create a report:
This article assumes you are familiar with the basics of writing custom reports in Spira.
In this example we will build a custom report with custom ESQL section.
To create the report you need to:
- Go to Administration > Edit Reports
- Click on Create a new Report (at the bottom of the list of existing Reports)
- Specify HTML format (the dynamic elements won't work in Word/PDF/Excel)
- Choose to add a Custom Section:

SQL Query:
5. Click Add New Custom Section and then
6. Copy and paste the below simple query to pull some incident information into the Query section of the window displayed:
SELECT INC.INCIDENT_ID, INC.NAME AS NAME, INC.PRIORITY_NAME AS PRIORITY, INC.INCIDENT_STATUS_NAME AS STATUS, INC.OWNER_NAME
FROM SpiraTestEntities.R_Incidents as INC where INC.PROJECT_ID = ${ProjectId}
7. You can click Preview Results button to see the sample of the results.
8. If you will click on Generate Default Template button, you will get a normal report as a table of data, that will also work for reporting purposes after saving changes.
Default template modification:
9. If you replace default template with the one from below, you will get the modern-looking HTML report ready for a web browser, that combines XSLT transformation rules with HTML and CSS:
<!DOCTYPE html>
<xsl:stylesheet version="1.0" xmlns:xsl="http://www.w3.org/1999/XSL/Transform" xmlns:msxsl="urn:schemas-microsoft-com:xslt" exclude-result-prefixes="msxsl">
<xsl:template match="/RESULTS">
<html lang="en">
<head>
    <meta charset="UTF-8">
    <meta name="viewport" content="width=device-width, initial-scale=1.0">
    <script src="https://cdn.tailwindcss.com"></script>
    <style>
        /* Custom styles to enhance readability and layout */
        body {
            font-family: 'Inter', sans-serif;
            background-color: #f3f4f6;
        }
        .container {
            max-width: 1000px;
        }
        .data-table {
            width: 100%;
            border-collapse: collapse;
            box-shadow: 0 4px 6px rgba(0, 0, 0, 0.1);
            border-radius: 0.5rem;
            overflow: hidden;
            border: 1px solid #e5e7eb;
            caption-side: top;
        }
        .data-table th, .data-table td {
            padding: 1rem;
            text-align: left;
            border-bottom: 1px solid #e5e7eb;
        }
        .data-table thead {
            background-color: #3b82f6;
            color: white;
            text-transform: uppercase;
            font-size: 0.875rem;
        }
        .data-table tbody tr {
            background-color: #ffffff;
            transition: all 0.2s ease-in-out;
        }
        .data-table tbody tr.filtered-out {
            display: none; /* Hide rows that don't match the filter */
        }
        .data-table tbody tr:hover {
            background-color: #dbeafe;
        }

    </style>
    </meta>
    </meta>
</head>
<body class="p-6">
    <div class="container mx-auto bg-white p-8 rounded-xl shadow-lg">
        <h1 class="text-4xl font-bold text-center text-gray-800 mb-6">Incident Report</h1>
        <table id="incident-table" class="data-table">
            <thead>
                <tr>
                    <th data-column="INCIDENT_ID">ID</th>
                    <th data-column="NAME">Name</th>
                    <th data-column="PRIORITY">Priority</th>
                    <th data-column="STATUS">Status</th>
                    <th data-column="OWNER_NAME">Owner</th>
                </tr>
            </thead>
            <tbody>
                <xsl:for-each select="/RESULTS/ROW">
                    <tr>
                        <td><xsl:value-of select="INCIDENT_ID"/></td>
                        <td><xsl:value-of select="NAME"/></td>
                        <td><xsl:value-of select="PRIORITY"/></td>
                        <td><xsl:value-of select="STATUS"/></td>
                        <td><xsl:value-of select="OWNER_NAME"/></td>
                    </tr>
                </xsl:for-each>
            </tbody>
        </table>
    </div>
</body>
</html>
</xsl:template>
</xsl:stylesheet>
Modification explanations:
10. Page Structure and Styling
Instead of just generating a table, this stylesheet creates a complete HTML document.
HTML & CSS: The <html, <head>, and <body> tags are embedded directly within the XSLT template. This means the final output will be a single, complete HTML page.
Tailwind CSS: The <script> tag in the <head> loads the Tailwind CSS library from a CDN. This is the primary source of the modern styling. The code uses utility classes like p-6 (padding), flex (flexbox layout), bg-white (background color), and shadow-lg (large box shadow) to build the layout and appearance.
Custom Styling: The <style> block contains additional, custom CSS rules. While most of the styling is handled by Tailwind, this section provides specific rules for a clean, professional look, such as defining the font family and controlling the table layout.
Highlighting a row on hover: you can change the color of the selection by modifying the background-color value:
.data-table tbody tr:hover {
    background-color: #dbeafe;
}
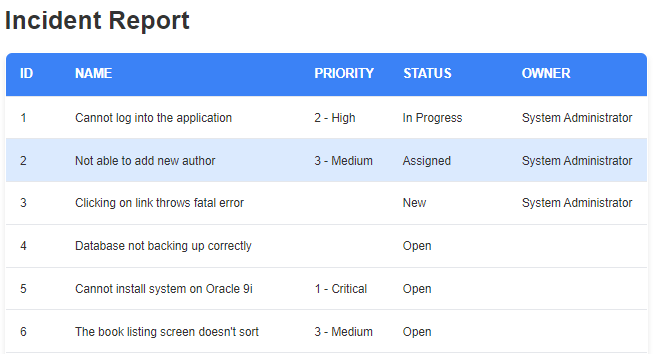
Sample output:
9. After that, the report is now ready for saving and running. Give the report a meaningful name and save it for further use.
10. Go to the product's report center and locate the newly created report. Click Generate and wait for the page to load. You should get something similar to this: