When implementing this DORA metric in Spira, we are making use of the following artifacts:
- Pull Request Tasks (which sync from CI/CD tools such as GitHub)
- Releases
In general, the lead time is calculated as the average duration between creation and merging of a Pull Request (PR). Using the Tasks view, we can find the difference in time between when the PR task was opened and closed. However since we want to look at our productivity improvement over time, we group the PRs by release and then average the PR duration over the release.
Displaying the Lead Time to Change by Release
So the following Spira custom graph takes in all the PRs in a product and averages the PR lead time per release for the 20 most recent releases.
select top (20) T.RELEASE_VERSION_NUMBER as ReleaseVersion, Avg(DiffHours(T.START_DATE, T.END_DATE)) as CycleTime
from SpiraTestEntities.R_Tasks as T
join SpiraTestEntities.R_TaskTypes as TT on T.TASK_TYPE_ID = TT.TASK_TYPE_ID
join SpiraTestEntities.R_Releases as RL on T.RELEASE_ID = RL.RELEASE_ID
where T.PROJECT_ID = ${ProjectId}
and TT.IS_PULL_REQUEST = True
and TT.IS_ACTIVE = True
and T.IS_DELETED = False
and RL.RELEASE_TYPE_ID in {1,2}
group by T.RELEASE_VERSION_NUMBER
order by T.RELEASE_VERSION_NUMBER desc
When you run this graph on the product home dashboard or the reports dashboard, it will look like the following:
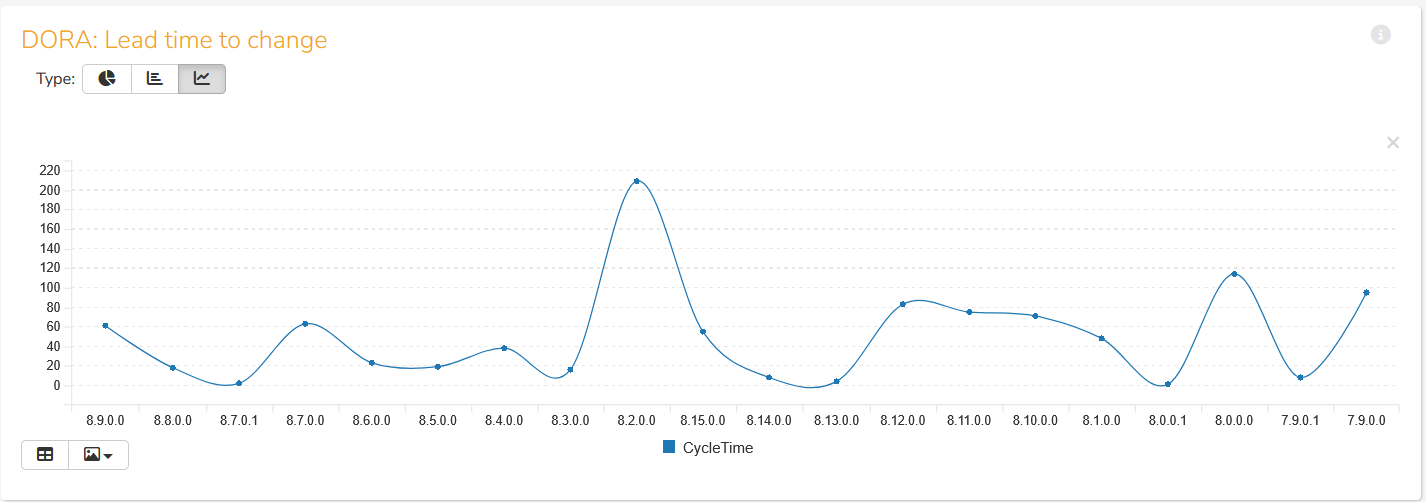
The x-axis is the release name, and the y-axis is the average duration of the PR in hours.
Displaying the Lead Time to Change by Release Date
The one issue with the previous graph is that it shows the lead time by release, but not by date. We can easily fix that by using the release end date for the x-axis instead:
select top (20) cast (month(RL.END_DATE) as string) + '/' + cast (day(RL.END_DATE) as string) as ReleaseDate,
   Avg(DiffHours(T.START_DATE, T.END_DATE)) as CycleTime
from SpiraTestEntities.R_Tasks as T
join SpiraTestEntities.R_TaskTypes as TT on T.TASK_TYPE_ID = TT.TASK_TYPE_ID
join SpiraTestEntities.R_Releases as RL on T.RELEASE_ID = RL.RELEASE_ID
where T.PROJECT_ID = ${ProjectId}
and TT.IS_PULL_REQUEST = True
and TT.IS_ACTIVE = True
and T.IS_DELETED = False
and RL.RELEASE_TYPE_ID in {1,2}
group by RL.END_DATE
order by RL.END_DATE desc
When we use this version of the graph, we get the following instead:
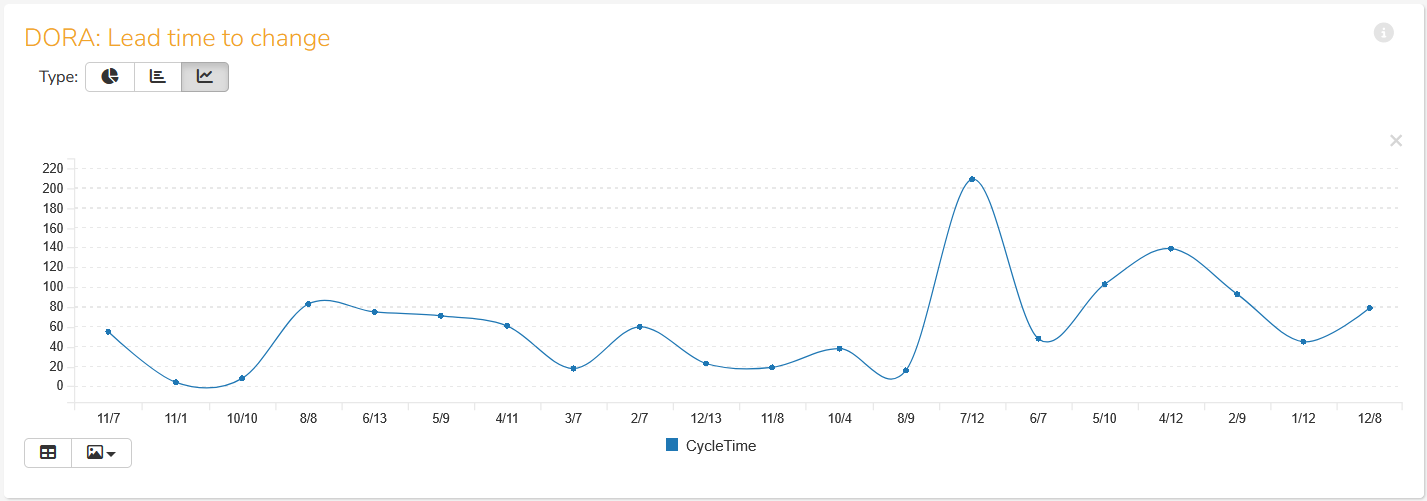
The x-axis is the release date (in the format M/Y), and the y-axis is the average duration of the PR in hours.