When implementing this DORA metric in Spira, we are making use of the following artifacts:
- Builds (which sync from CI/CD tools such as GitHub)
- Releases
In general, the deployment frequency is determined by dividing the total number of successful deployments by the number of days in the given period. A successful deployment is defined as a build pipeline that has a status of 'Success' and is for the 'main' branch. For those projects using the GitFlow methodology, the 'develop' branch may be the appropriate branch instead.
Displaying the Deployment Frequency by Release
Since we want to look at our productivity improvement over time, we group the deployment builds by release and then count the ratio of successful deployments against the release duration, grouped by the release:
select top (20) B.RELEASE_VERSION_NUMBER as ReleaseVersion,
   round(cast (count(B.BUILD_ID) as double) / cast (diffdays(RL.START_DATE, RL.END_DATE) as double), 2) as DeploymentFrequency
from SpiraTestEntities.R_Builds as B
join SpiraTestEntities.R_Releases as RL on B.RELEASE_ID = RL.RELEASE_ID
where B.PROJECT_ID = ${ProjectId}
and B.BUILD_STATUS_ID = 2
and B.NAME LIKE ('%develop%')
and diffdays(RL.START_DATE, RL.END_DATE) > 0
and RL.RELEASE_TYPE_ID in {1,2}
group by B.RELEASE_VERSION_NUMBER, RL.START_DATE, RL.END_DATE
order by B.RELEASE_VERSION_NUMBER desc
When you run this graph on the product home dashboard or the reports dashboard, it will look like the following:
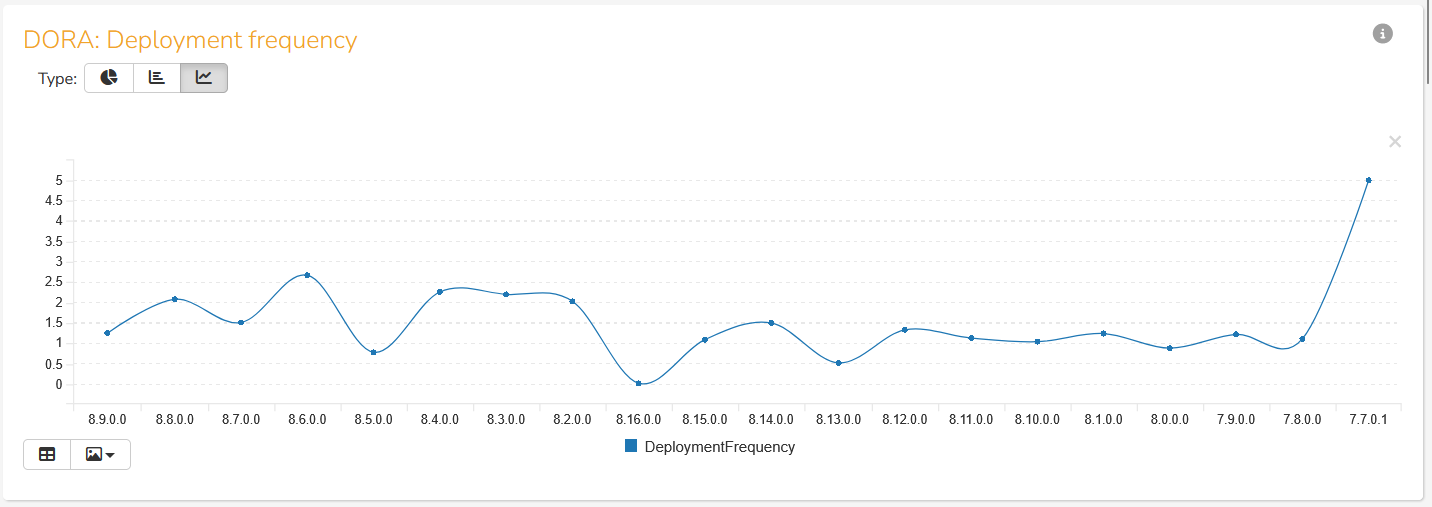
The x-axis is the release name, and the y-axis is the number of deployments per day.
Displaying the Deployment Frequency by Release Date
The one issue with the previous graph is that it shows the deployment frequency by release, but not by date. We can easily fix that by using the release end date for the x-axis instead:
select top (20) cast (month(RL.END_DATE) as string) + '/' + cast (day(RL.END_DATE) as string) as ReleaseDate,
   round(cast (count(B.BUILD_ID) as double) / cast (diffdays(RL.START_DATE, RL.END_DATE) as double), 2) as DeploymentFrequency
from SpiraTestEntities.R_Builds as B
join SpiraTestEntities.R_Releases as RL on B.RELEASE_ID = RL.RELEASE_ID
where B.PROJECT_ID = ${ProjectId}
and B.BUILD_STATUS_ID = 2
and B.NAME LIKE ('%develop%')
and diffdays(RL.START_DATE, RL.END_DATE) > 0
and RL.RELEASE_TYPE_ID in {1,2}
group by RL.START_DATE, RL.END_DATE
order by RL.END_DATE desc
When we use this version of the graph, we get the following instead:
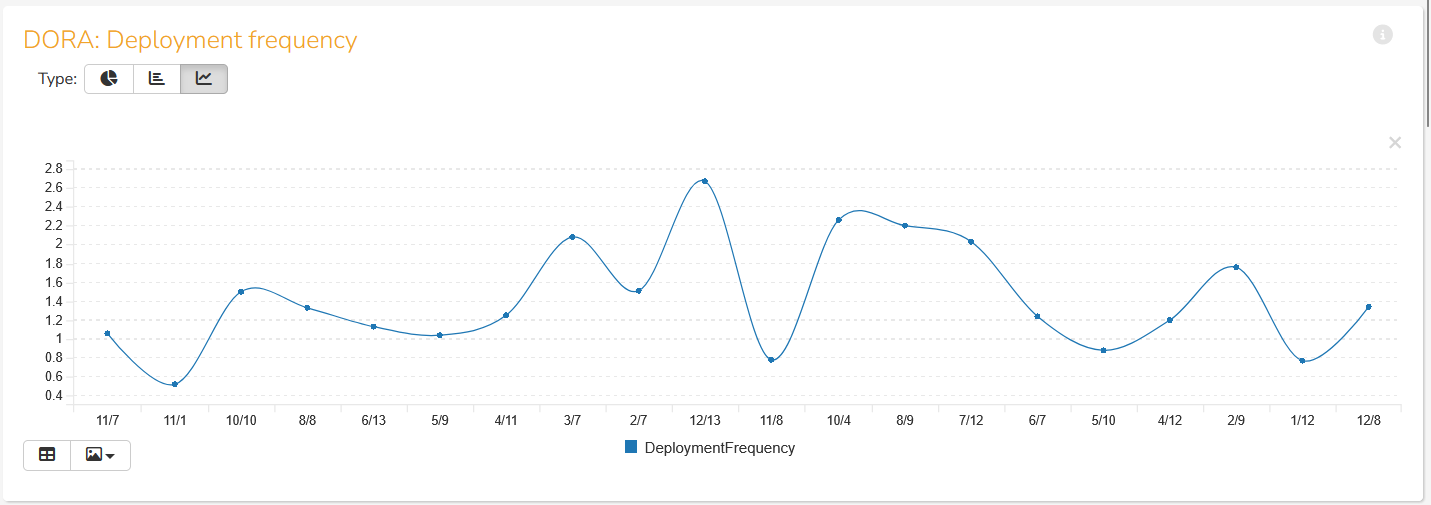
The x-axis is the release date (in the format M/Y) , and the y-axis is the number of deployments per day.