When implementing this DORA metric in Spira, we are making use of the following artifacts:
- Releases
- Incidents
- Builds (which sync from CI/CD tools such as GitHub)
In general, the change failure rate is calculated by dividing the number of incidents by the total number of successful deployments. Incidents are defined as P1 bugs in work items. Successful deployment are defined as a build pipeline that has a status of 'Success' and is for the 'main' branch. For GitFlow environments it would be the 'develop' branch instead.
Since we want to look at our productivity improvement over time, we group the results release and then count the failure rate by release.
Displaying the Change Failure Rate by Release
So the following Spira custom graph looks at the Priority P1 Bug incidents in the product, and determines the total ratio of incidents per deployment for each of the 20 most recent releases:
select top (20) RL.VERSION_NUMBER as ReleaseVersion,
   round(cast (count(distinct IC.INCIDENT_ID) as double) / cast (count(distinct B.BUILD_ID) as double) * 100, 2) as FailureRatePercent
from SpiraTestEntities.R_Releases as RL
left join (select value IC from SpiraTestEntities.R_Incidents as IC where IC.INCIDENT_TYPE_NAME = 'Bug' and IC.PRIORITY_NAME = '1 - Critical') as IC
   on RL.RELEASE_ID = IC.DETECTED_RELEASE_ID
join (select value B from SpiraTestEntities.R_Builds as B where B.BUILD_STATUS_ID = 2 and B.NAME LIKE ('%develop%')) as B
   on RL.RELEASE_ID = B.RELEASE_ID
where RL.PROJECT_ID = ${ProjectId}
and RL.RELEASE_TYPE_ID in {1,2}
and RL.IS_DELETED = False
group by RL.VERSION_NUMBER, RL.START_DATE, RL.END_DATE
order by RL.VERSION_NUMBER desc
When you run this graph on the product home dashboard or the reports dashboard, it will look like the following:
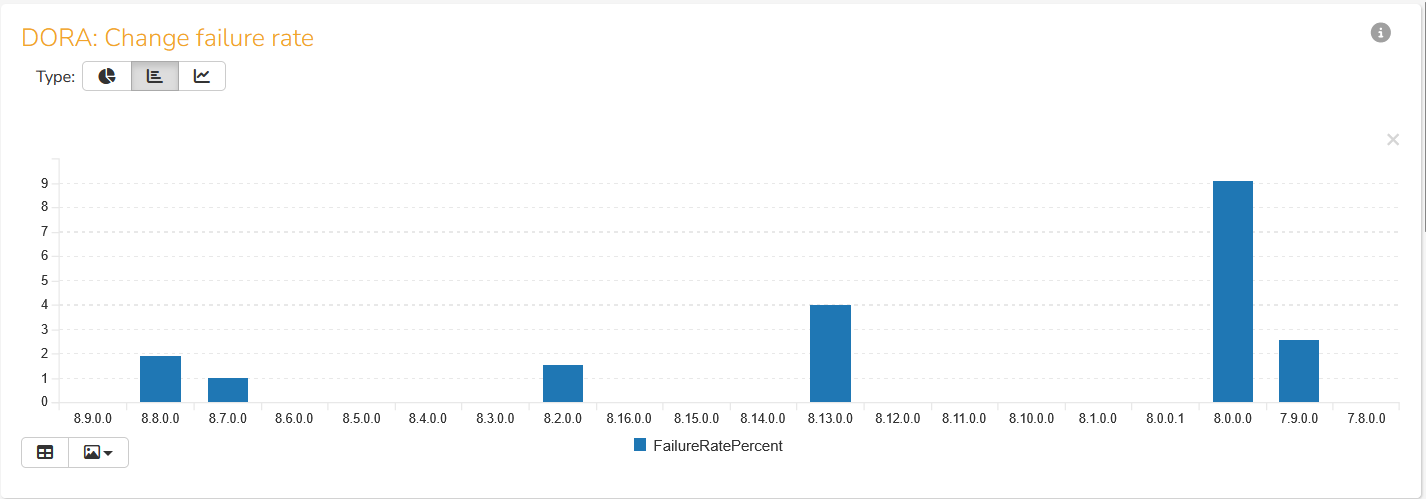
The x-axis is the release name, and the y-axis is the ratio of P1 Bug incidents to deployments (builds) expressed as a percentage.
Displaying the Change Failure Rate by Release Date
The one issue with the previous graph is that it shows the change failure rate by release, but not by date. We can easily fix that by using the release end date for the x-axis instead:
select top (20) cast (month(RL.END_DATE) as string) + '/' + cast (day(RL.END_DATE) as string) as ReleaseDate,
   round(cast (count(distinct IC.INCIDENT_ID) as double) / cast (count(distinct B.BUILD_ID) as double) * 100, 2) as FailureRatePercent
from SpiraTestEntities.R_Releases as RL
left join (select value IC from SpiraTestEntities.R_Incidents as IC where IC.INCIDENT_TYPE_NAME = 'Bug' and IC.PRIORITY_NAME = '1 - Critical') as IC
   on RL.RELEASE_ID = IC.DETECTED_RELEASE_ID
join (select value B from SpiraTestEntities.R_Builds as B where B.BUILD_STATUS_ID = 2 and B.NAME LIKE ('%develop%')) as B
   on RL.RELEASE_ID = B.RELEASE_ID
where RL.PROJECT_ID = ${ProjectId}
and RL.RELEASE_TYPE_ID in {1,2}
and RL.IS_DELETED = False
group by RL.END_DATE
order by RL.END_DATE desc
When we use this version of the graph, we get the following instead:
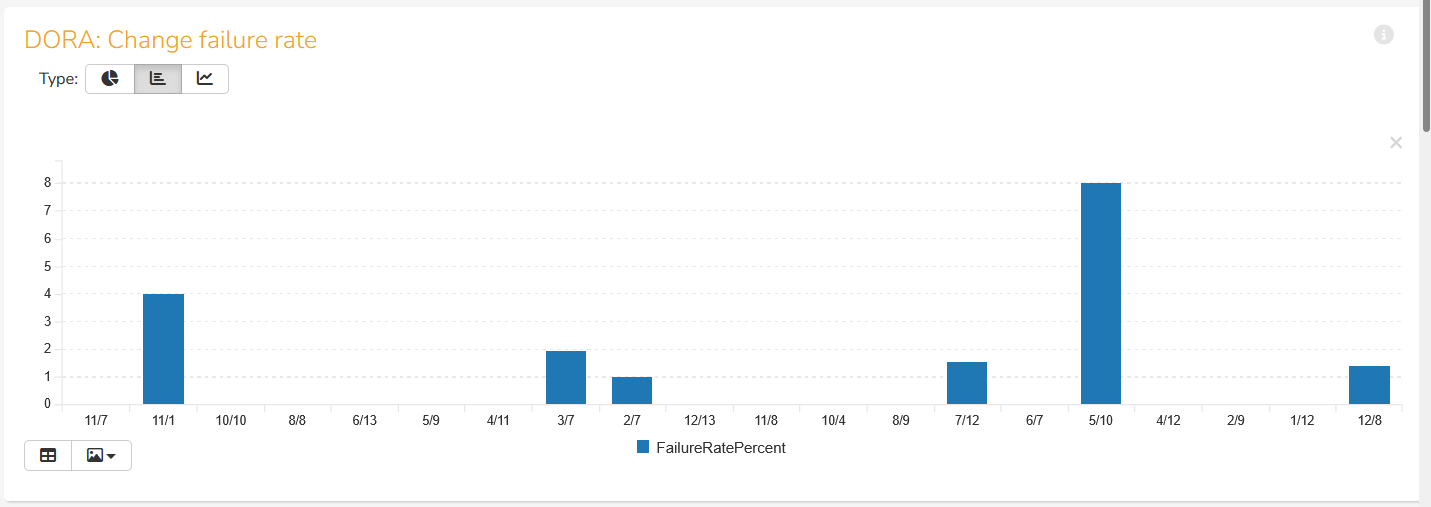
The x-axis is the release date (in the format M/Y), and the y-axis is the ratio of P1 Bug incidents to deployments (builds) expressed as a percentage.