When implementing this DORA metric in Spira, we are making use of the following artifacts:
- Releases
- Incidents
- Builds (which sync from CI/CD tools such as GitHub)
In general, the mean time to recover (MTTR) is calculated by the average time it takes to close an incident within a period of time. Incidents are defined as P1 bugs.
In this case we average the time it takes to close the P1 bugs found in a release.
Displaying the MTTR by Release
So the following Spira custom graph looks at the Priority P1 Bug incidents introduced in each release of the product, and displays the average number of days need to close the bugs:
select top (20) RL.VERSION_NUMBER as ReleaseVersion,
 avg(DiffDays(IC.CREATION_DATE, IC.CLOSED_DATE)) as RecoveryTimeDays
from SpiraTestEntities.R_Releases as RL
join (select value IC from SpiraTestEntities.R_Incidents as IC where IC.INCIDENT_TYPE_NAME = 'Bug' and IC.PRIORITY_NAME = '1 - Critical' and IC.CLOSED_DATE is not null and IC.INCIDENT_STATUS_IS_OPEN_STATUS = False) as IC
   on RL.RELEASE_ID = IC.DETECTED_RELEASE_ID
where RL.PROJECT_ID = ${ProjectId}
and RL.RELEASE_TYPE_ID in {1,2}
and RL.IS_DELETED = False
group by RL.VERSION_NUMBER, RL.START_DATE, RL.END_DATE
order by RL.VERSION_NUMBER desc
When you run this graph on the product home dashboard or the reports dashboard, it will look like the following:
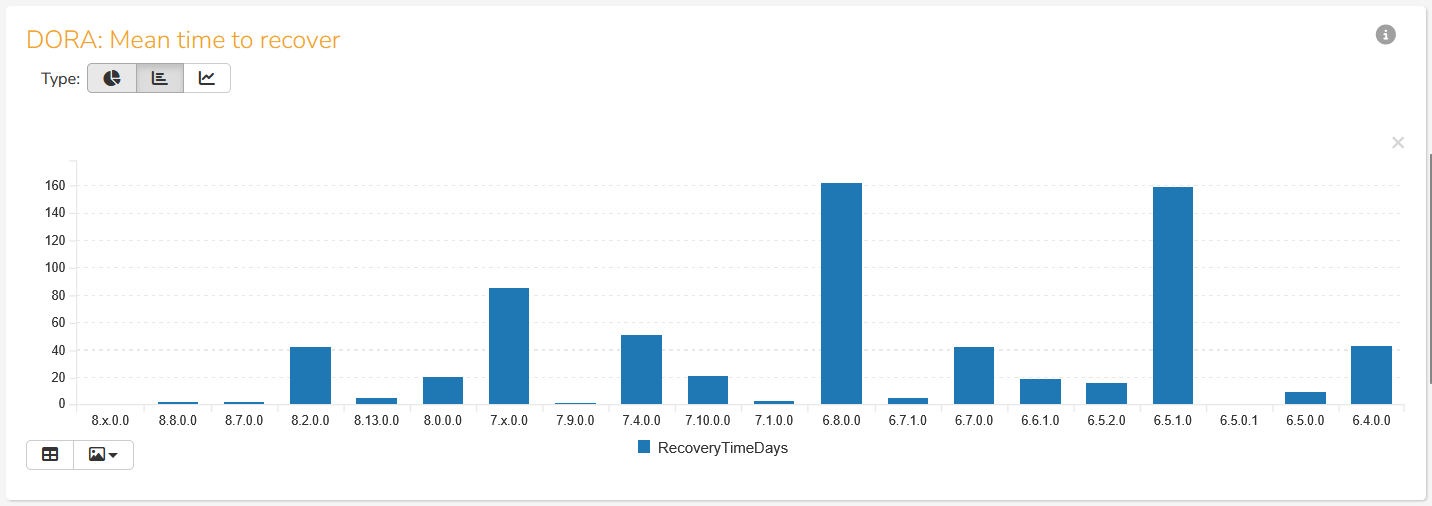
The x-axis is the release name, and the y-axis is the recovery time in days needed to fix the P1 bug incidents introduced into that release.
Displaying the MTTR by Release Date
The one issue with the previous graph is that it shows the MTTR by release, but not by date. We can easily fix that by using the release end date for the x-axis instead:
select top (20) cast (month(RL.END_DATE) as string) + '/' + cast (day(RL.END_DATE) as string) as ReleaseDate,
 avg(DiffDays(IC.CREATION_DATE, IC.CLOSED_DATE)) as RecoveryTimeDays
from SpiraTestEntities.R_Releases as RL
join (select value IC from SpiraTestEntities.R_Incidents as IC where IC.INCIDENT_TYPE_NAME = 'Bug' and IC.PRIORITY_NAME = '1 - Critical' and IC.CLOSED_DATE is not null and IC.INCIDENT_STATUS_IS_OPEN_STATUS = False) as IC
   on RL.RELEASE_ID = IC.DETECTED_RELEASE_ID
where RL.PROJECT_ID = ${ProjectId}
and RL.RELEASE_TYPE_ID in {1,2}
and RL.IS_DELETED = False
group by RL.END_DATE
order by RL.END_DATE desc
When we use this version of the graph, we get the following instead:
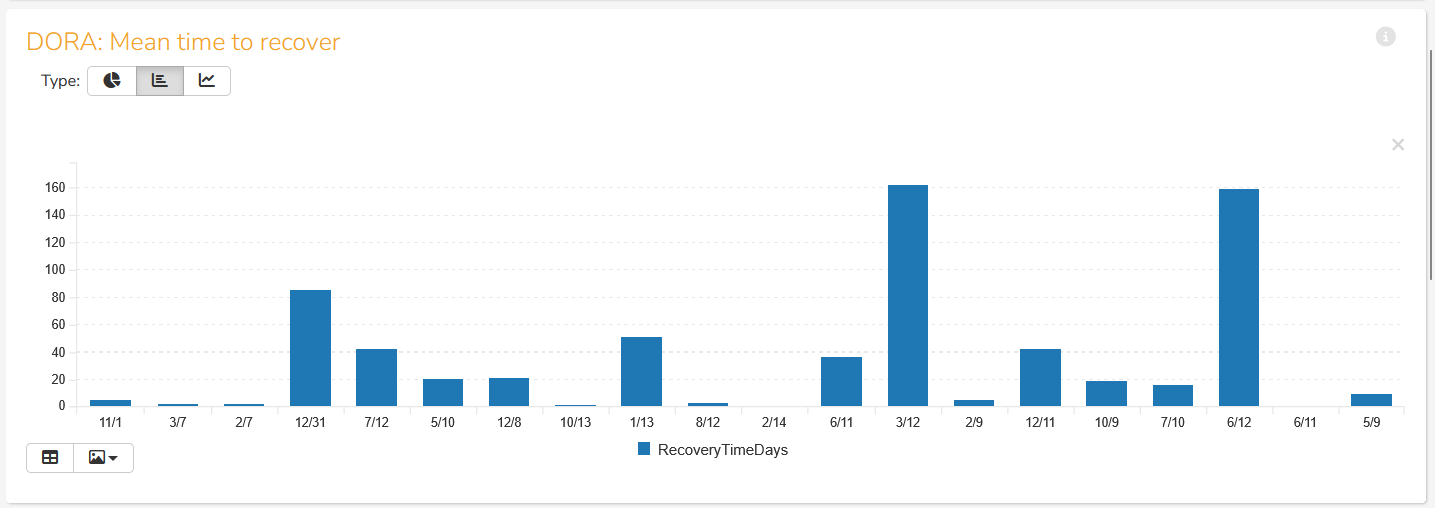
The x-axis is the release date (in the format M/Y), and the y-axis is the recovery time in days needed to fix the P1 bug incidents introduced into that release.