Overview
Many customers have asked us how to display a variety of different quality metrics in our Spira platform. There are many out of the box graphs, charts and reports that will cover most needs, but sometimes you need specific metrics or data. In this whitepaper we outline the various metrics and KPIs you should be measuring, and include details on how to get these metrics from Spira.
Requirements Metrics
Requirement Coverage
Displaying the number of Requirements with mapped test cases vs. requirements with no mapped test cases (with capability to view specific requirements):
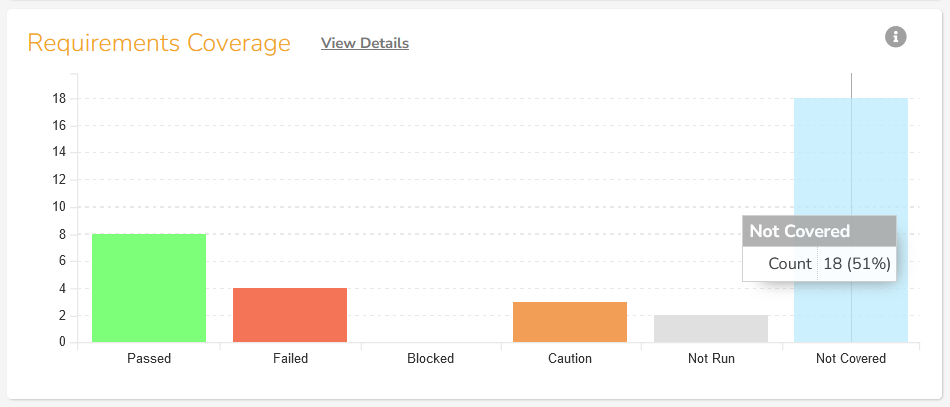
This is an out of the box graph on the product home page.
https://spiradoc.inflectra.com/Spira-User-Manual/Product-Homepage/#requirements-coverage
Requirement Change to TC Mapping
Displaying the number of requirements (with changes) with mapped test cases that are yet to be updated (with capability to view specific requirements)
When a requirement is changed and a test case is not yet changed, the test case has a suspect flag. So, the best way to get this data is to get a graph of the number of requirements that are linked to at least one suspect test case vs. the number that are not. The following custom graph gets this data:
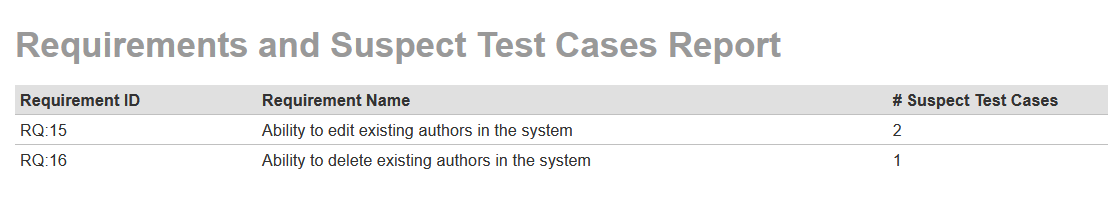
https://www.inflectra.com/Support/KnowledgeBase/KB821.aspx
Test Design Metrics
Test Case Status
Displaying the number of test cases per status e.g. Draft, Pending Review, Pending Approval, Approved, etc.
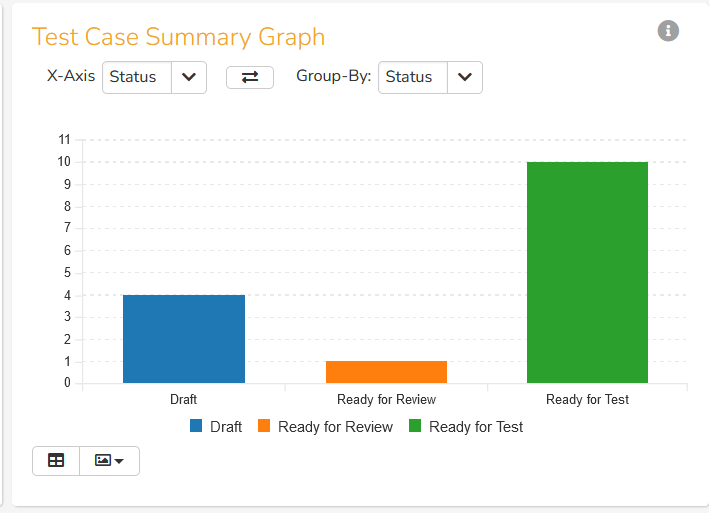
This is an out of the box graph on the product reports dashboard.
https://spiradoc.inflectra.com/Spira-User-Manual/Reports-Center/#test-case-summary-graph
Requirement Coverage
Displaying the number of test cases per requirement:
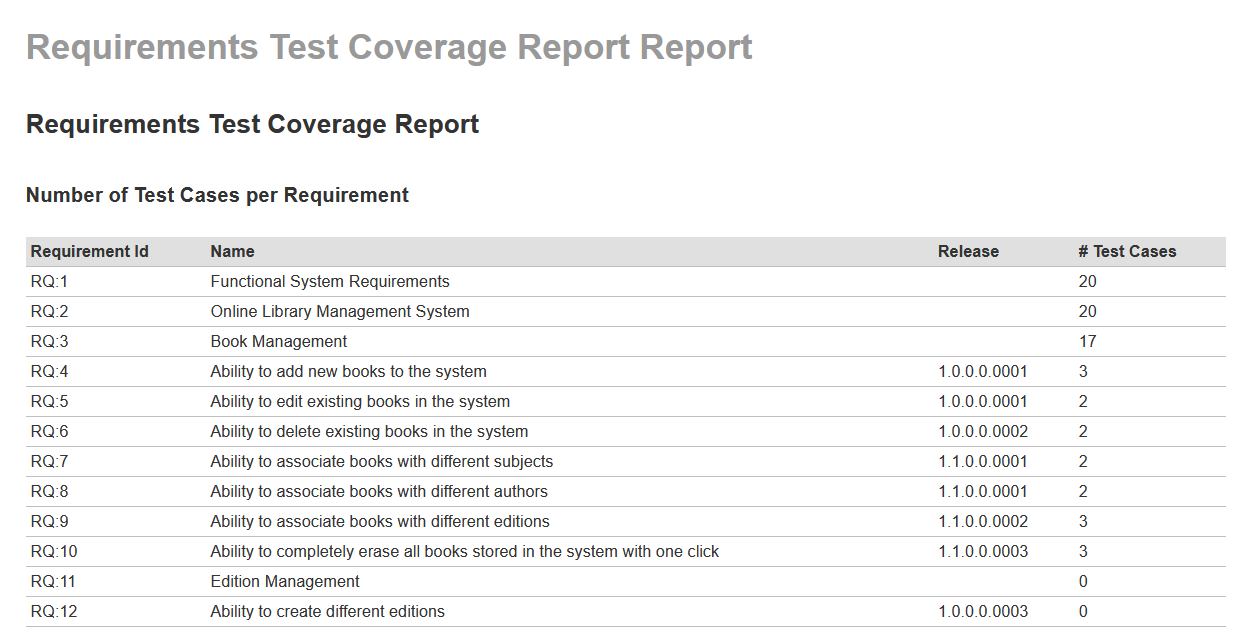
https://www.inflectra.com/Support/KnowledgeBase/KB822.aspx
Displaying the number of test cases with no mapped requirements (with capability to view specific test cases with no mapped requirements):
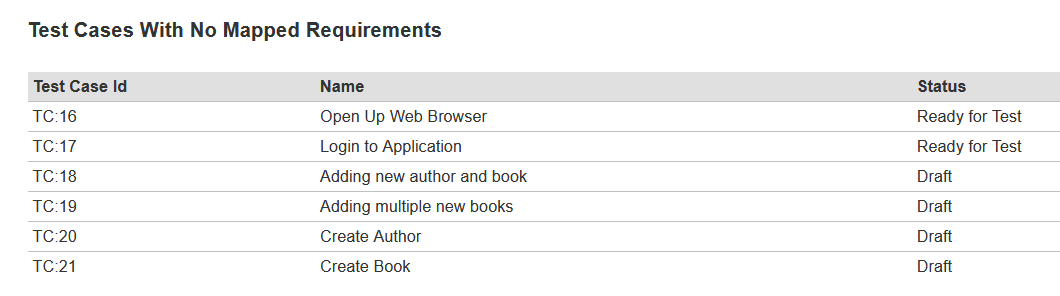
https://www.inflectra.com/Support/KnowledgeBase/KB822.aspx
Test Case Creation Productivity
Displaying the number of test cases created per day:
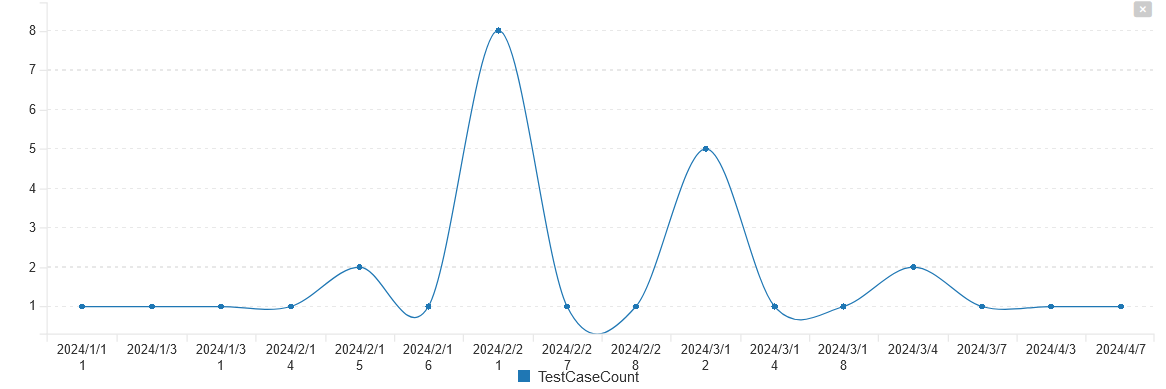
https://www.inflectra.com/Support/KnowledgeBase/KB823.aspx
Test Execution Metrics
Execution Rate
Displaying the total (passed + failed test cases) / total number of test cases:
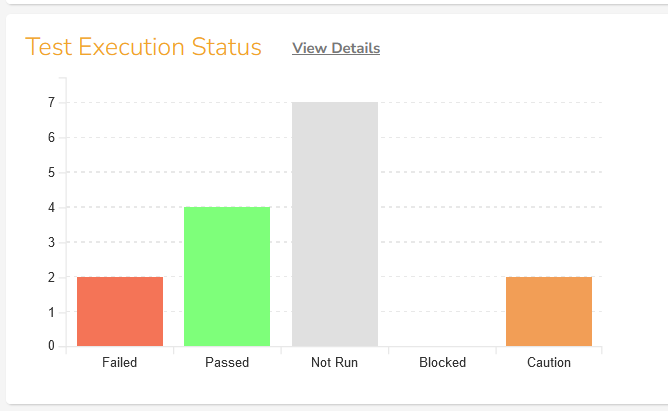
This is an out of the box graph on the product home page.
https://spiradoc.inflectra.com/Spira-User-Manual/Product-Homepage/#test-execution-status
Another common metric that this graph can used for is displaying the number of passed test cases / the total number Total TCs.
Requirement Coverage
Displaying the number of requirements tested vs. the number of requirements yet to be tested (with capability to view execution status per requirements):
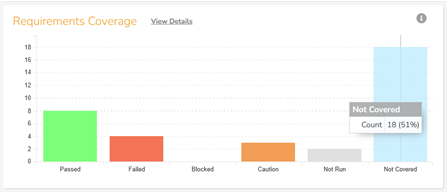
https://spiradoc.inflectra.com/Spira-User-Manual/Product-Homepage/#requirements-coverage
This graph can be also used to handle the requirements passed testing vs requirements yet to pass testing (with capability to view execution status per requirements) KPI as well.
Test Execution Productivity
Displaying the average test execution duration per test case:
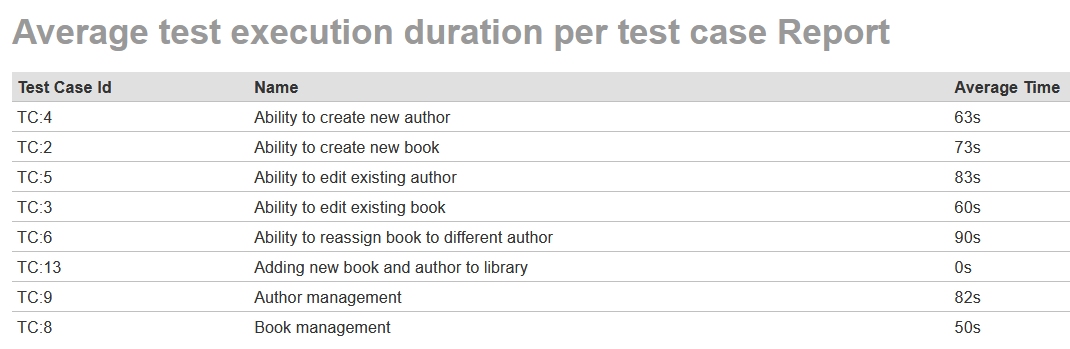
https://www.inflectra.com/Support/KnowledgeBase/KB824.aspx
Defect Metrics
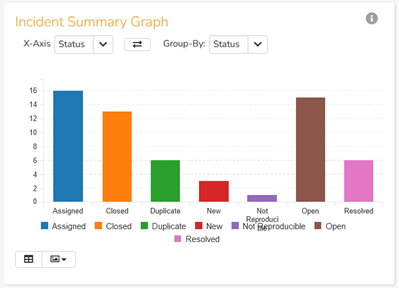
Defect by Status
Displaying the number of defects per status:
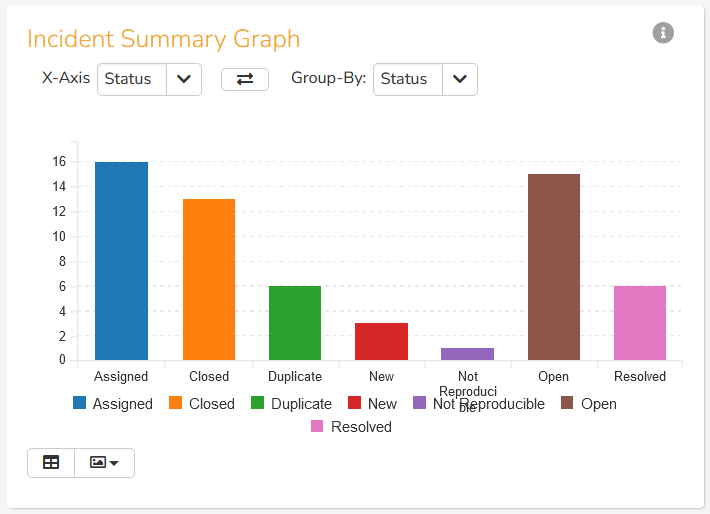
This is an out of the box graph on the product reports dashboard.
https://spiradoc.inflectra.com/Spira-User-Manual/Reports-Center/#incident-summary-graph
Defect by Severity
Displaying the number of defects per priority or severity (capability to filter by defect status):
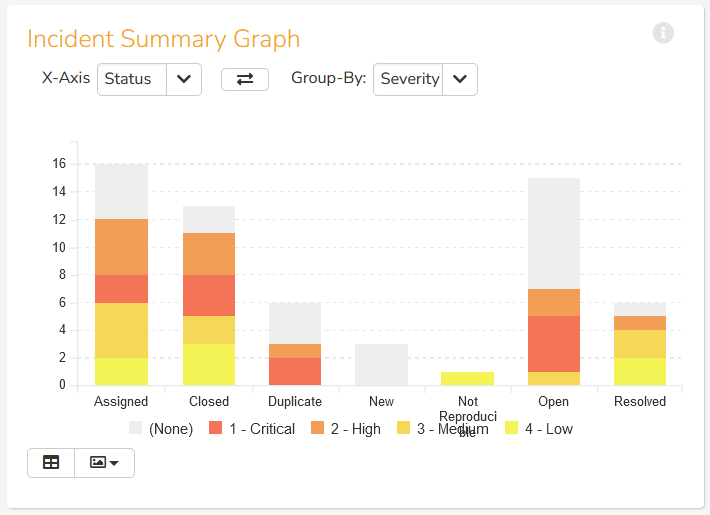
This is an out of the box graph on the product reports dashboard.
https://spiradoc.inflectra.com/Spira-User-Manual/Reports-Center/#incident-summary-graph
Defect Occurrence Rate
Displaying the number of defects opened per day:
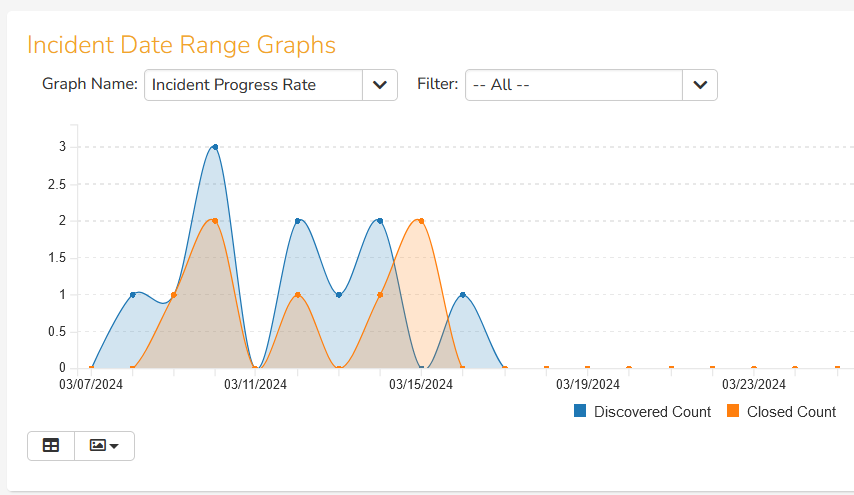
This is an out of the box graph on the product reports dashboard.
https://spiradoc.inflectra.com/Spira-User-Manual/Reports-Center/#incident-progress-rate-graph
Defect Closure Rate
Displaying the number of defects closed per day:
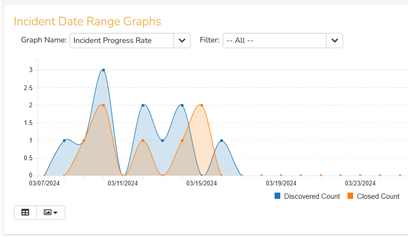
This is an out of the box graph on the product reports dashboard.
https://spiradoc.inflectra.com/Spira-User-Manual/Reports-Center/#incident-progress-rate-graph
Defect Rejection Rate
Displaying the number of defects rejected / number of total defects:
This is an out of the box graph on the product reports dashboard that shows the number of rejects as one of the bars.
To get just the rejection rate, we can also use a custom report.
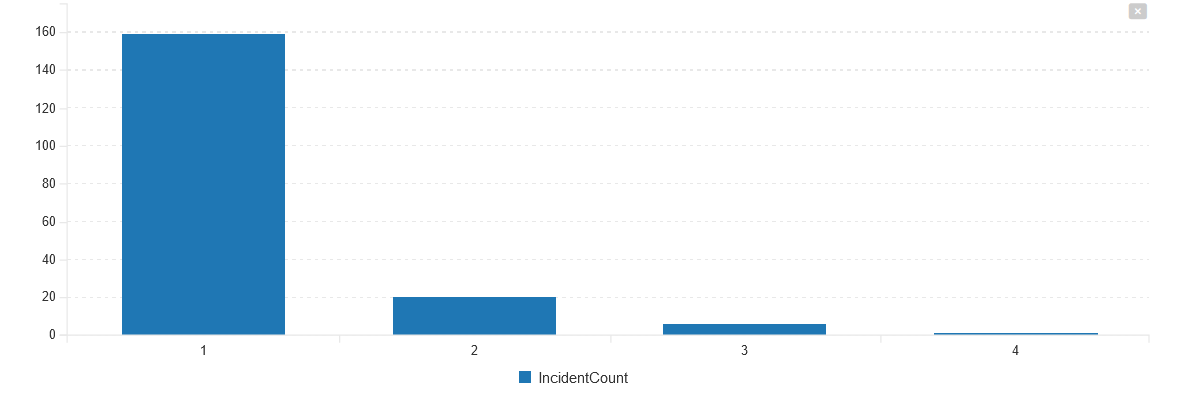
Defect Re-Open/Bounceback Rate
Displaying the number of defects per re-open/bounceback instance. For example:
- Total of 100 defects
- 0 - # of defects that were not re-opened/bouncedback after retest of fix
- 1 - # of defects that were re-opened/bouncedback ONE time after retest of fix
- 2 - # of defects that were re-opened/bouncedback TWO times after retest of fix
- 3 - # of defects that were re-opened/bouncedback THREE times after retest of fixso on
This can be displayed as a custom graph, either a bar chart:
Or if you prefer, a donut chart:
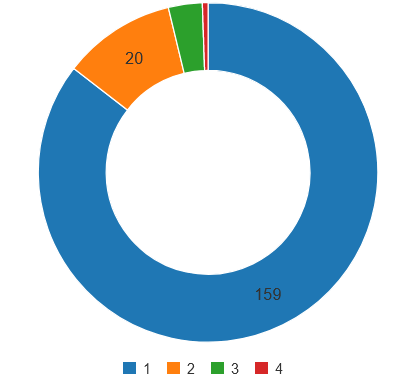
https://www.inflectra.com/Support/KnowledgeBase/KB826.aspx
Defect Aging by Severity
Displaying the defect by duration (days/hrs from opening of defect up to closure):
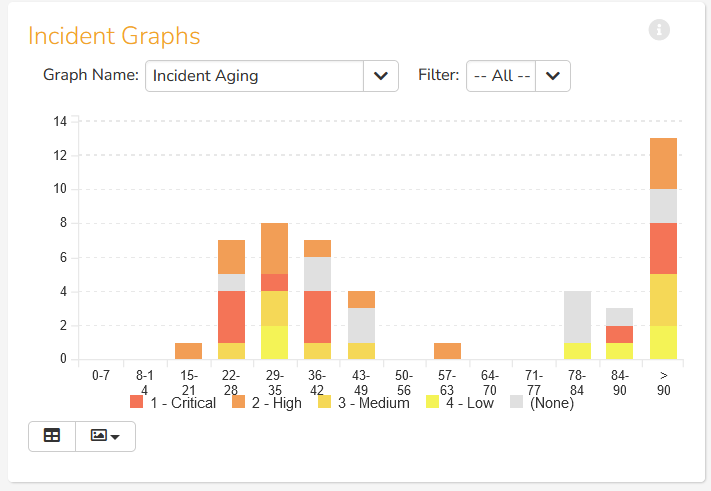
This is an out of the box graph on the product reports dashboard.
https://spiradoc.inflectra.com/Spira-User-Manual/Reports-Center/#incident-aging-graph
Defect Duration from Status 1 to Status 2
Displaying the defect by duration from a specific status to another status (e.g. days/hrs from New status to Tested status):
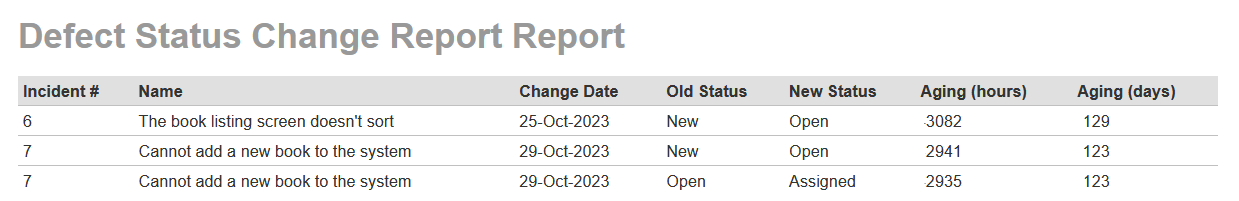
https://www.inflectra.com/Support/KnowledgeBase/KB825.aspx
Defect by Category
Displaying the number of defects per defect category:
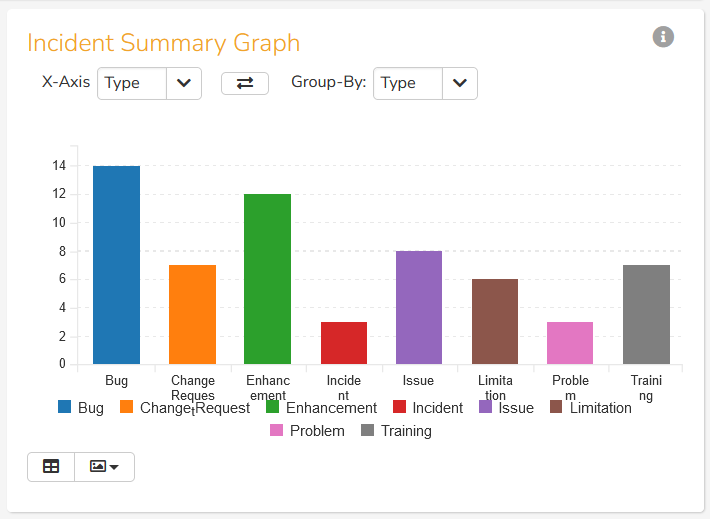
This is an out of the box graph on the product reports dashboard.
https://spiradoc.inflectra.com/Spira-User-Manual/Reports-Center/#incident-summary-graph
Defect by Component
Display the number of defects per assigned product component:
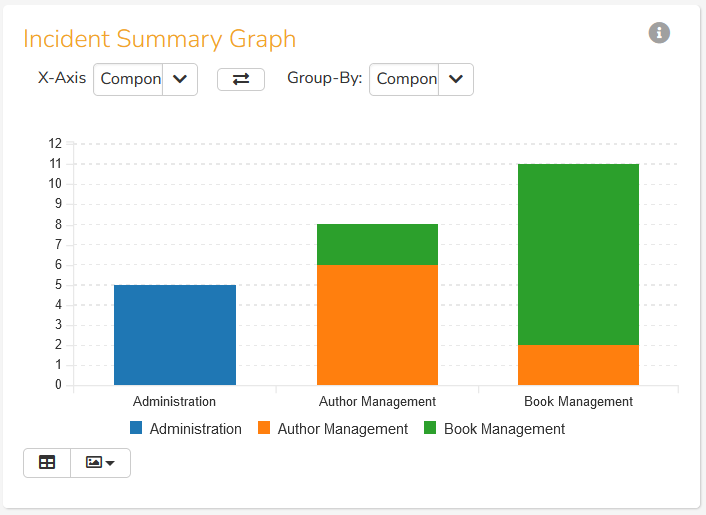
This is an out of the box graph on the product reports dashboard.
https://spiradoc.inflectra.com/Spira-User-Manual/Reports-Center/#incident-summary-graph
Requirement Coverage
Display the number of requirements with defects (with capability to view specific requirements with defects):
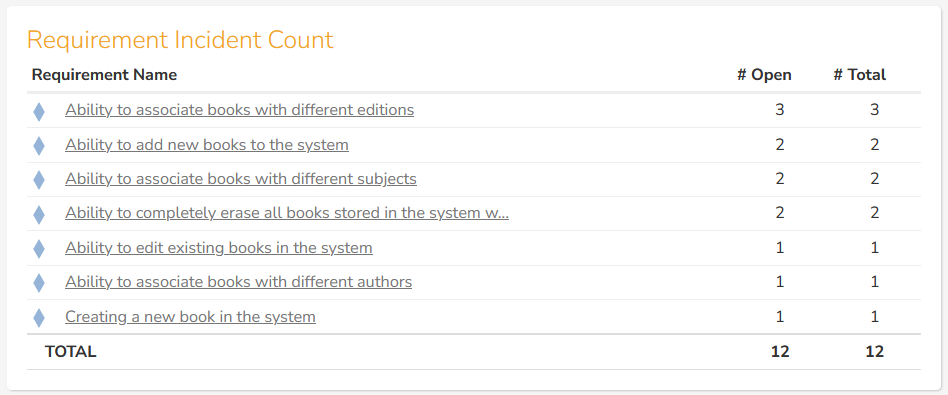
This is an out of the box table on the product home page.
https://spiradoc.inflectra.com/Spira-User-Manual/Product-Homepage/#requirement-incident-count
This table will also display the number of requirements with open defects (with capability to view specific requirements with open defects).
Risk Based Testing Metrics
Requirements Risk Exposure Report
With SpiraPlan, you have the ability to create and manage both risks and requirements in the same system. You can use the Associations feature to link the requirements to risks. However, as part of a risk-based testing methodology, you will often want to see which of your requirements have the greatest overall, aggregate associated risk.
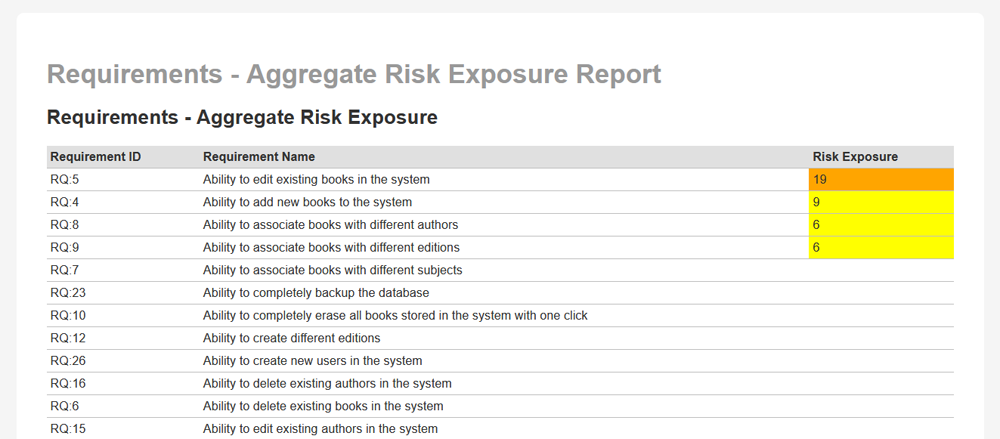
https://www.inflectra.com/Support/KnowledgeBase/KB695.aspx
Test Case Risk Exposure Report
With SpiraPlan, you have the ability to create and manage risks, requirements and test cases in the same system. You can use the Associations feature to link the requirements to risks, and the test coverage feature to link requirements to test cases. However, as part of a risk-based testing methodology, you will often want to see which of your test cases have the greatest overall, aggregate associated risk; if you are limited in time, these are the most critical tests to execute.
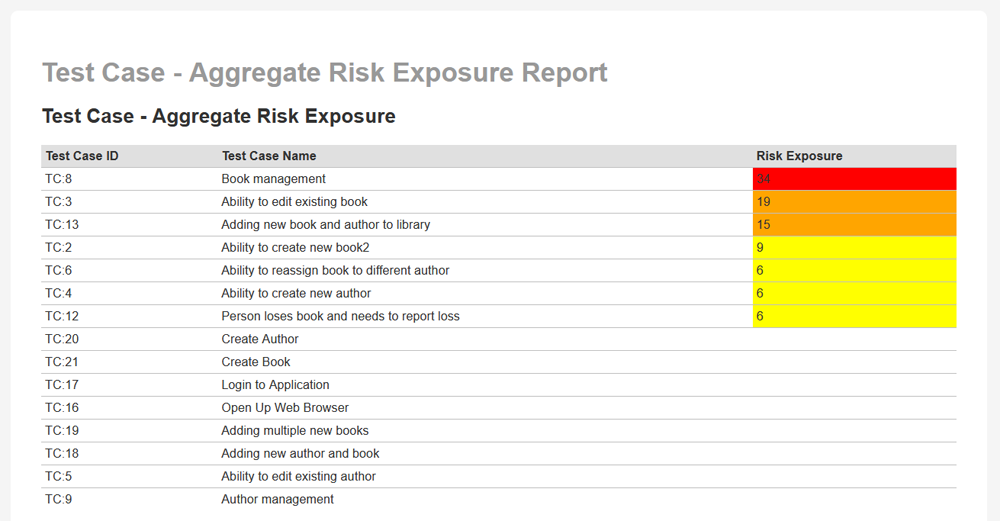
https://www.inflectra.com/Support/KnowledgeBase/KB696.aspx
Conclusion
As you can see, there are lots of different metrics and reports that you can generate in SpiraTest, SpiraTeam or SpiraPlan. Using a mixture of out of the box graphs and charts and our extensive knowledge base of custom reports, you have all of your metrics covered. The best thing is that if you want something slightly different, you also have the power to change the report and make that happen.